YAI XAU/USD Analysis: The $4,269 Price Map, FOMC Shock and the Transition From Selling Highs to Buying Lows
By Yaipubi Chanu | YAI — Spot Gold XAUUSD
Analysis • Algorithms • Education • Robots
The latest XAU/USD price action demonstrates exactly why YAI focuses on advance price mapping, correlations and adaptive execution rather than reacting to Gold only after a major economic event has already occurred.
On 14 September 2026, YAI identified $4,269 as an important downside price map for XAU/USD. This projection was published before the Federal Reserve’s September monetary-policy decision and before the subsequent volatility pushed Gold toward and eventually below this region.
The significance is in the sequence: the level came first; the catalyst and price movement followed.
FOMC: The Catalyst Behind the Volatility
On 16 September, the Federal Reserve unanimously increased its target range for the federal funds rate by 25 basis points, to 3.75%–4.00%. The Fed said inflation remained somewhat elevated and that the increase was intended to support a timely return of inflation toward its 2% objective.
For Gold, however, the rate decision itself was only one part of the equation.
YAI does not interpret monetary policy through a simplistic formula such as “rate hike = Gold down.” The more useful question is how the decision changes the entire intermarket structure: US Treasury yields, the US Dollar, USD/JPY, real-rate expectations, energy prices, the Gold/Silver ratio and the market’s expectations for the next Fed decision.
That correlation framework became especially important during the post-FOMC price action.
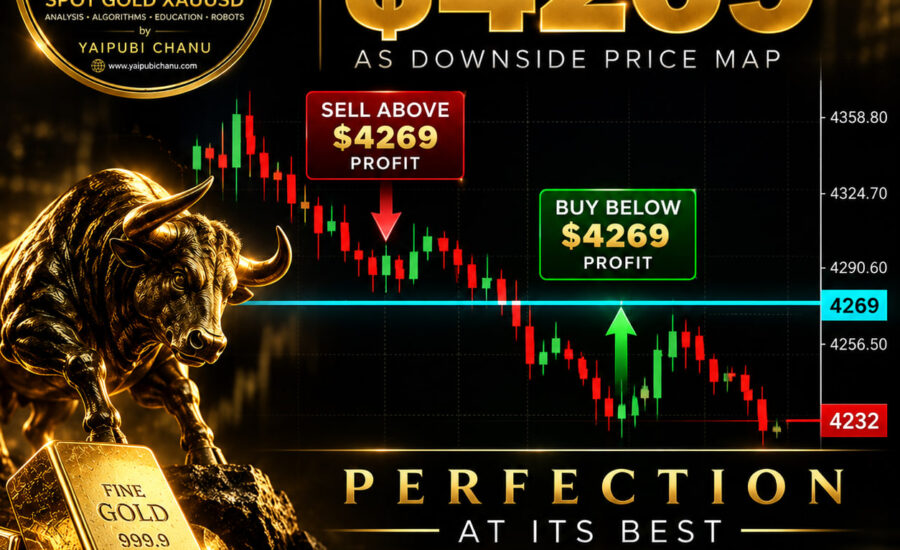
$4,269 Was Projected on 14 September
YAI had already mapped:
XAU/USD → $4,269 downside price target
on 14 September 2026.
The original timestamped projection is available here:
YAI — $4,269 advance projection
And the subsequent validation:
This distinction is fundamental to the YAI methodology.

Anyone can explain a market move after it has happened. YAI is being developed around a different objective: identify important price regions in advance, track the correlations capable of driving price toward those regions, and adapt execution when price arrives.
Selling Above $4,269 — Buying Below $4,269
The most interesting part of the sequence was not simply Gold reaching the projected region.
It was how the trading logic changed around it.
While XAU/USD remained substantially above $4,269, the projected downside map provided a reference for capturing the decline toward the target.
Once Gold reached and moved below the projected region, however, continuing to chase the downside offered a very different risk/reward profile.
YAI therefore shifted its focus toward BUYING LOWS.
The logic was straightforward:
Above $4,269 → the opportunity was the move toward the projected downside map.
Around/below $4,269 → the focus shifted toward accumulating lower prices and looking for recovery opportunities.
A downside projection does not mean a trader should continue selling indefinitely after the target has been achieved.
Price location changes the strategy.
Yesterday: $4,269 Became the Buying Reference
After initially serving as the downside objective, $4,269 became an important buying reference yesterday.
This represents one of the central ideas behind YAI: the same price can perform completely different functions at different stages of a market cycle.
Before arrival, $4,269 represented a destination.
At arrival, it became a decision zone.
Below it, the market entered an area where YAI’s attention increasingly shifted toward finding discounted buying opportunities rather than aggressively initiating new shorts.
This is why YAI works with price zones rather than treating individual numbers as absolute barriers.
Gold does not have to reverse exactly at $4,269 for the level to remain analytically useful.

Today’s Extension Toward $4,232
Today’s price action provided an even deeper test.
After trading through the $4,269 region, XAU/USD extended toward approximately $4,232 on the trading screen being monitored for this analysis.
That extension is important.
A trader who interprets $4,269 as an absolute floor might regard every dollar below it as failure. YAI approaches the market differently.
The system studies the distance from the projected cluster, liquidity expansion, session behavior, momentum and correlations before determining whether an overshoot represents invalidation or an increasingly attractive lower-price environment.
The distinction between a price target and a reversal zone therefore becomes critical.
Today’s Correlations Matter
Today’s intermarket picture also helps explain why Gold remained under pressure after FOMC.
The correlation screen being monitored showed approximately:
US 10-Year yield: 4.952%
USD/JPY: 155.14
Crude Oil: 102.39
XAU/XAG: 67.51
XAU/USD: lower-$4,300 region during the captured observation
These are intraday screen readings rather than official closing values and can change rapidly.
The important information is not any single number—it is the relationship between the variables.
Elevated Treasury yields can increase the opportunity cost associated with holding non-yielding Gold. USD/JPY can provide another view of Dollar/rate dynamics. Oil becomes relevant through inflation expectations, while XAU/XAG can provide information about the relative behavior of precious metals.
YAI therefore does not depend on one correlation.
The algorithm is being designed to monitor more than 30 parameters, including session shifts, liquidity mapping, confluences, data-driven reversal behavior and multiple correlation combinations.
Why YAI Does Not Chase Lows
One principle remains especially important during extreme volatility:
Do not confuse a successful downside projection with an instruction to keep selling lower and lower prices.
When Gold has already traveled significantly toward or beyond a projected downside cluster, the risk profile changes.
That is why the YAI approach moved from benefiting from weakness above $4,269 to concentrating on potential buying opportunities around and below $4,269.
The market subsequently extending toward $4,232 does not eliminate the need for risk management. It reinforces it.
No algorithm, correlation model or projected cluster guarantees a reversal. Position sizing, margin management and predefined risk remain essential.
Projection → Catalyst → Target → Adaptation
The entire sequence can be summarized chronologically:
14 September: YAI projects $4,269 as a downside XAU/USD price map.
16 September: FOMC delivers a 25-basis-point rate increase, generating a new monetary-policy repricing environment.
Post-FOMC: Gold experiences renewed volatility and downside pressure.
$4,269 region: the previously published downside map is reached.
After reaching the target: YAI changes its emphasis from capturing downside toward $4,269 to buying lower prices around and below the projected region.
17 September: XAU/USD extends toward approximately $4,232, while Treasury yields, USD/JPY and other correlations remain central to determining the next phase.
This is the philosophy behind YAI — Yaipubi Artificial Intelligence:
Analysis identifies the map.
Algorithms process the relationships.
Correlations provide context.
Price action provides validation.
Risk management controls execution.
The objective is not to predict every candle.
The objective is to prepare important price zones before the market reaches them, understand what macroeconomic forces could drive Gold there, and adapt when the market moves from one phase of the price map into another.
$4,269 was projected before the FOMC volatility. The level was subsequently reached and crossed. The focus then transitioned toward buying lower prices rather than chasing shorts at the lows.
That is the YAI approach to XAU/USD: data first, price mapping in advance, correlation-based validation and disciplined execution.