XAU/USD: From $5,595 to $3,970 — Anatomy of an Extraordinary Eight-Month Price Cycle
By Yaipubi Chanu | YAI — Spot Gold XAU/USD
A Historic Eight Months for Gold
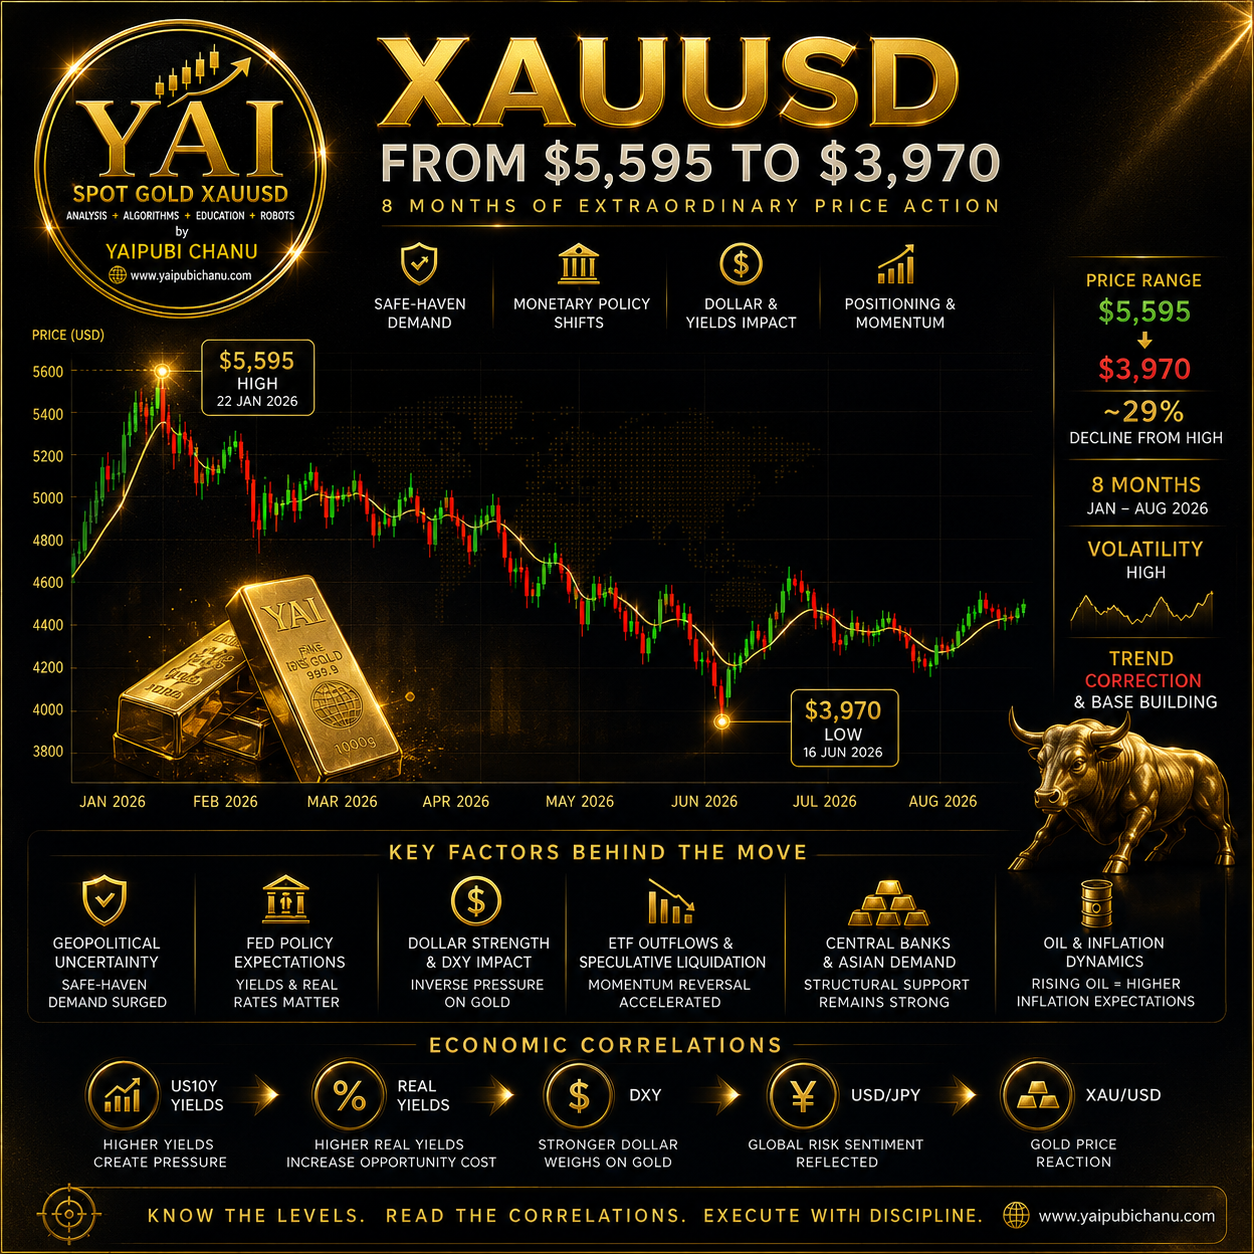
The last eight months have represented one of the most volatile phases in modern XAU/USD trading. Gold surged to approximately $5,595 per ounce in late January 2026, following an extraordinary advance driven by geopolitical uncertainty, safe-haven demand, central-bank diversification and investor positioning. It subsequently experienced a severe correction, eventually testing the $3,970–$4,000 region around June–July. Independent historical price data records a January high near $5,594 and a June/July low around $3,951–$3,961, broadly validating this $5,595-to-$3,970 framework.
$5,595: When Safe-Haven Demand Reached an Extreme
Gold’s advance toward $5,595 was not simply a technical breakout. The move developed against a combination of geopolitical instability, concerns surrounding the long-term purchasing power of the US dollar, sovereign-debt uncertainty and exceptionally strong investment demand. The World Gold Council reports that Gold established more than twelve all-time highs during the first part of 2026 and moved above $5,500 intraday in January. More recently, institutional and high-net-worth demand for physical bullion has also remained notable.
Momentum Amplified the Rally
One of the most important lessons from this period is that fundamentals may initiate a movement, but positioning and momentum can dramatically amplify it. According to the World Gold Council’s Gold Return Attribution Model, momentum accounted for approximately 24% of the variability in Gold’s first-half performance, more than any individual macro category in its model. Trend-following, speculative positioning and options activity therefore appear to have contributed significantly to both the acceleration toward the peak and the subsequent reversal.
The Reversal: $5,595 Was Followed by Aggressive Liquidation
Once Gold reached an extreme valuation and positioning environment, the market became increasingly vulnerable to profit-taking. The correction was initially associated with substantial speculative liquidation. As leveraged and momentum-driven positions were reduced, the same forces that had accelerated the upside began operating in reverse. OANDA identifies the initial decline from the January high around $5,595 as being largely associated with a collapse in speculative positioning, accompanied by changes in trading volumes, open interest and options-market conditions.
Federal Reserve Expectations Changed the Equation
The next major pressure came from monetary policy. Gold produces no interest income, so its relative attractiveness is heavily influenced by the return investors can earn from cash and government bonds. As markets reassessed the Federal Reserve’s inflation response and the possibility of tighter monetary conditions, nominal and real yields became increasingly important headwinds. Higher real yields increase the opportunity cost of holding Gold and can encourage capital to migrate toward interest-bearing assets.
The US Dollar and Gold’s Inverse Correlation
The DXY–XAU/USD relationship remained another essential part of the price structure. A stronger dollar generally creates pressure on dollar-denominated Gold, while dollar weakness tends to provide support. This relationship is not mechanically perfect, but it remains economically significant. World Gold Council research indicates that foreign-exchange movements accounted for about 14% of Gold’s H1 price variability in its attribution model, illustrating why analysing XAU/USD without simultaneously analysing the US dollar can produce an incomplete picture.
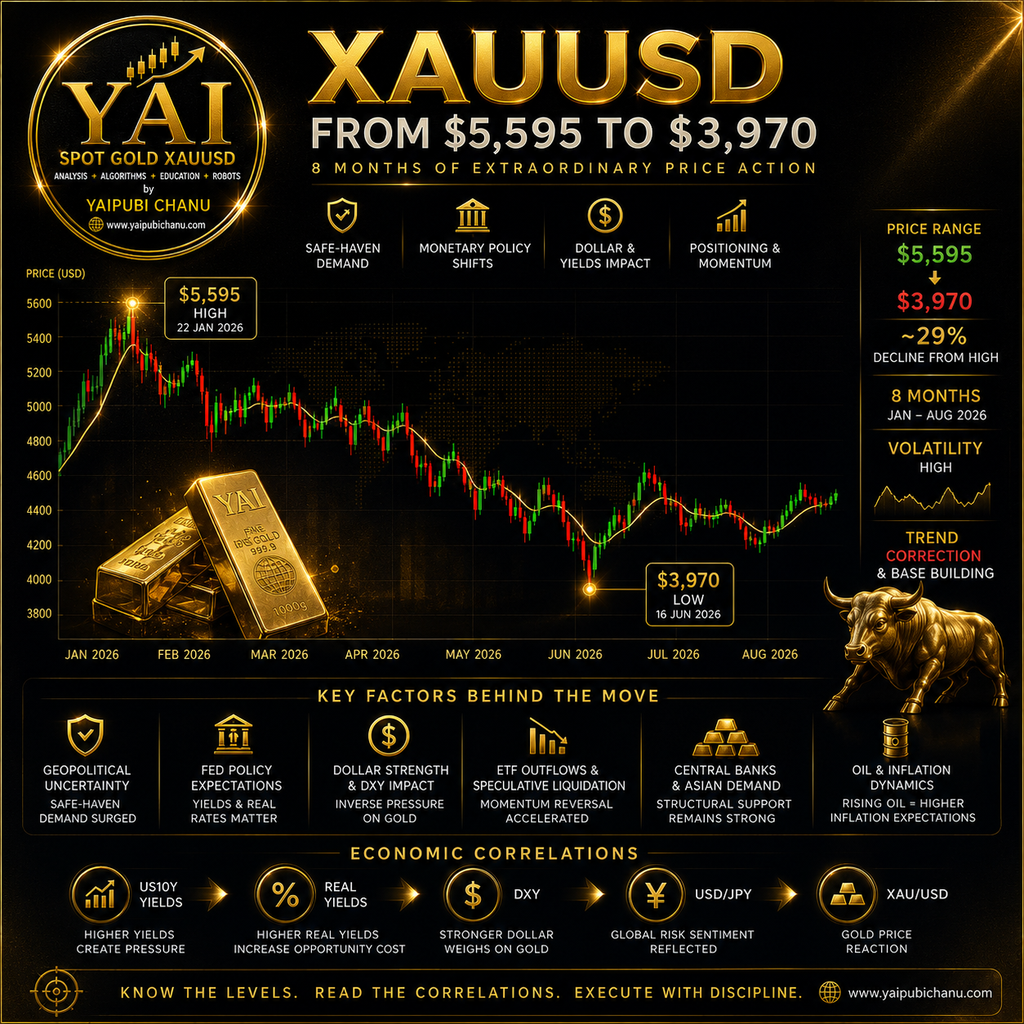
US10Y → Real Yields → DXY → XAU/USD
My preferred framework is therefore to study Gold through a chain of interconnected markets rather than in isolation:
US10Y → Real Yields → DXY → USD/JPY → XAU/USD
When Treasury and real yields rise, Gold’s opportunity cost normally increases. If higher yields simultaneously support the dollar, the pressure on XAU/USD can intensify. Conversely, falling yields combined with a weaker dollar can create a substantially more favourable environment for Gold. The 2026 experience demonstrates, however, that correlations can temporarily break when geopolitical risk, positioning or Asian demand becomes dominant.
Geopolitical Risk Produced Both Support and Volatility
Normally, escalating geopolitical uncertainty encourages safe-haven flows into Gold. Yet 2026 demonstrated why traders should never assume that geopolitical tension automatically means Gold must rise. The US-Iran conflict contributed substantially to market uncertainty, but its effects also travelled through crude oil, inflation expectations, Treasury yields and the dollar. Consequently, an event that initially appears bullish for Gold can become temporarily bearish if higher energy prices produce higher inflation expectations, rising yields and tighter anticipated monetary policy.
ETF Outflows Accelerated the Decline
Investment flows also mattered significantly during the correction. Global physically backed Gold ETFs recorded approximately $8.9 billion of outflows in June, according to the World Gold Council. North American funds experienced particularly substantial withdrawals. These flows coincided with expectations of higher interest rates, rising real yields and a stronger dollar—creating a combination of monetary and positioning pressures as Gold approached the psychologically important $4,000 region.
$3,970–$4,000: From Liquidation to Stabilisation
The decline toward approximately $3,970–$4,000 represented a very different market environment from the January peak. By this stage, speculative excess had been substantially reduced, positioning had adjusted and the price itself was beginning to attract renewed investment interest. Gold repeatedly tested the $4,000 area during July before stabilising. The World Gold Council noted that positive momentum and renewed ETF flows helped offset pressure from rising yields during July.
Central Banks Remained an Important Structural Support
One reason the correction should not be viewed purely as the collapse of Gold’s fundamental story is continued official-sector demand. Central banks purchased an estimated 289 tonnes in Q2 2026, according to the World Gold Council, a substantial acceleration from Q1. Reserve diversification, geopolitical uncertainty and the strategic desire to hold assets outside another country’s liability structure continue to provide an important long-term demand foundation.
Asian Demand Changed Gold Price Discovery
Another increasingly important factor is Asia. World Gold Council intraday analysis suggests that many Gold rebounds during H1 occurred during Asian trading hours, while several pullbacks were concentrated during US hours. Asian Gold ETFs also recorded exceptionally strong H1 inflows despite substantial June outflows. This reinforces my view that XAU/USD analysis can no longer be based solely on Federal Reserve policy and US macroeconomic data; China, India, Asian investment flows and central-bank activity increasingly influence global Gold price discovery.
The Economic Correlation Map
For me, the $5,595-to-$3,970 movement is best understood through interconnected correlations rather than one headline:
Fed expectations ↑ → Real yields ↑ → DXY potentially ↑ → Gold pressure
Fed expectations ↓ → Real yields ↓ → DXY potentially ↓ → Gold support
Geopolitical risk ↑ → Safe-haven demand ↑ → Gold support
Oil ↑ sharply → Inflation expectations ↑ → Yields potentially ↑ → Gold initially vulnerable
ETF/Speculative liquidation ↑ → Momentum ↓ → Gold pressure
Central-bank + Asian demand ↑ → Structural support for Gold
These relationships are conditional rather than absolute. What matters is identifying which transmission mechanism dominates at a particular moment.
My Perspective: Price, Time and Correlation Must Be Analysed Together
The journey from $5,595 to approximately $3,970 was a decline of roughly $1,625 per ounce, or about 29% from the peak. Yet the deeper lesson is not simply the size of the correction. It demonstrates how rapidly Gold can transition between safe-haven accumulation, momentum expansion, speculative liquidation, monetary-policy repricing and renewed strategic demand.
At YAI, my approach is therefore to combine price action, liquidity, Fibonacci structure, moving averages, volatility, algorithms and macroeconomic correlations rather than relying on a single indicator.
Gold does not move because of one factor. It moves when liquidity, expectations, positioning and macro correlations converge.
— Yaipubi Chanu | YAI — Spot Gold XAU/USD
World Gold Council — Gold Mid-Year Outlook 2026