XAU/USD at $4,600: Why Patience Matters More Than Prediction at a Critical Gold Decision Zone
Correlations, Fibonacci Structure, Treasury Yields and the Economic Forces Shaping Gold
By Yaipubi Chanu | YAI — Spot Gold XAU/USD
Gold approaching $4,600 presents one of those market conditions where conviction should be replaced by disciplined observation. The level is significant not because it guarantees a reversal or breakout, but because several technical and intermarket factors are converging around the same area.
From the YAI perspective, $4,600 should be treated as a decision zone rather than a directional guarantee.
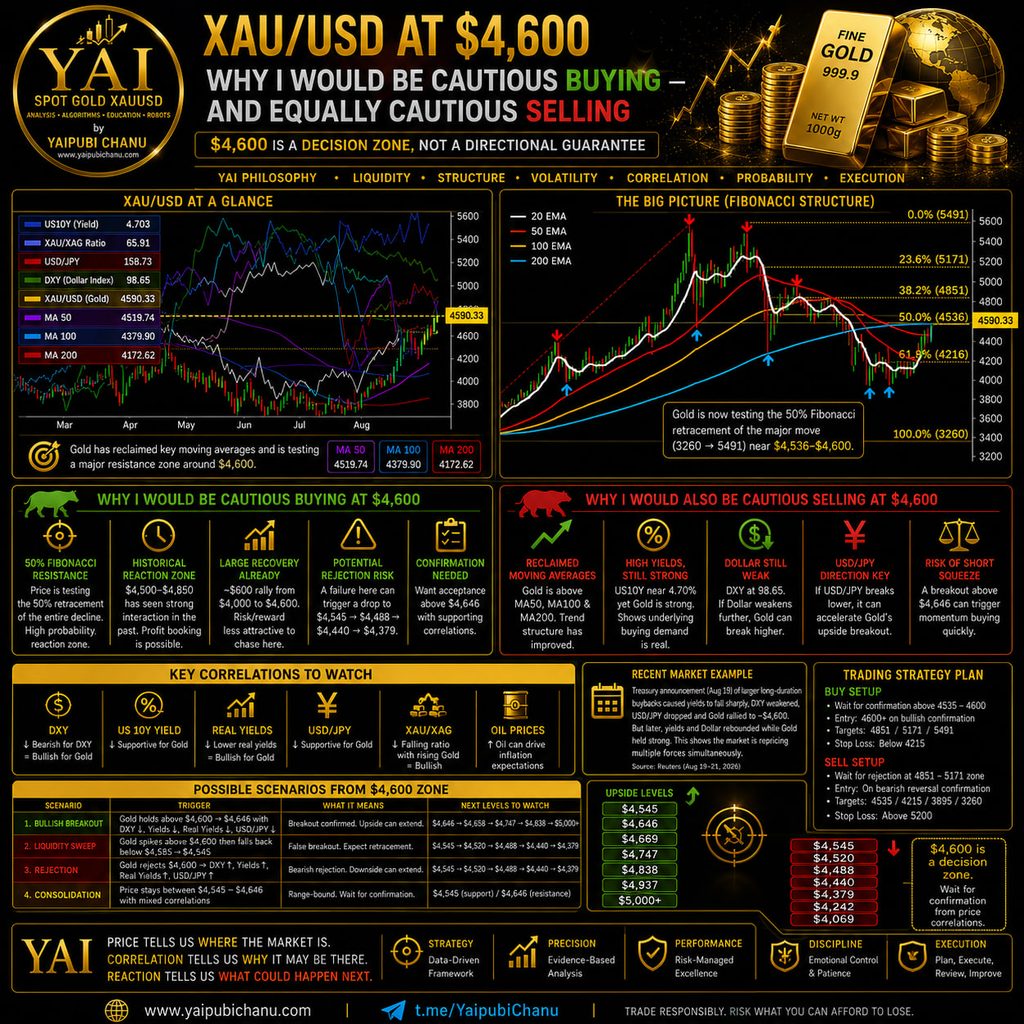
After a substantial recovery from the recent lows, XAU/USD has regained important moving-average structures and returned toward the 50% Fibonacci retracement region around $4,536–$4,600. This creates an interesting conflict: the improving structure provides reasons to remain constructive on Gold, while the size of the recovery and proximity to major resistance provide equally valid reasons not to chase the market aggressively.
The objective, therefore, is not to predict. It is to evaluate liquidity, structure, volatility, correlation, probability and execution.
The Technical Significance of $4,600
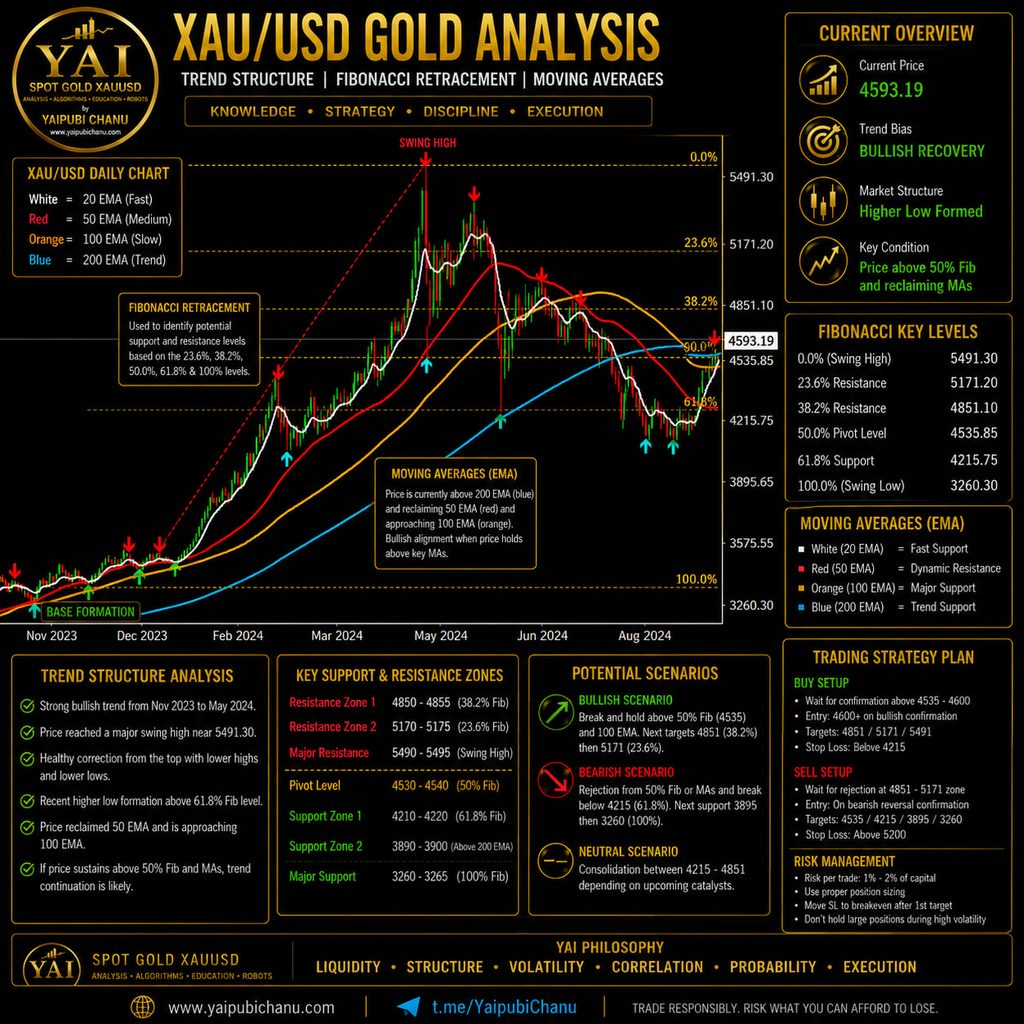
The larger Fibonacci structure shown in the analysis measures the major movement between approximately $3,260 and $5,491.
That structure produces several important reference areas:
$5,491 — 0% major swing high
$5,171 — 23.6% Fibonacci level
$4,851 — 38.2% Fibonacci level
$4,536 — 50% Fibonacci level
$4,216 — 61.8% Fibonacci level
$3,260 — 100% major swing low
Gold’s recovery toward $4,600 therefore places price just above the midpoint of this major range.
That is important.
A sustained recovery above the 50% region could strengthen the argument that the previous decline was corrective and that Gold is rebuilding a broader bullish structure. Failure to establish acceptance above the area, however, could turn the same zone into resistance.
This is precisely why buying and selling both require caution around $4,600.
Why I Would Be Cautious Buying Gold Here
The first concern is simply location.
Gold has already completed a substantial recovery from roughly the $4,000 region toward $4,600. Buying after a large expansion can produce an inferior risk-to-reward profile compared with buying during the earlier stages of the recovery.
The second consideration is Fibonacci resistance. The market is interacting with the 50% retracement area, while approximately $4,851 represents the next major 38.2% reference.
The third issue is historical reaction.
The broader $4,500–$4,850 region has demonstrated significant interaction in the analyzed structure. Markets frequently become volatile around areas where previous buyers and sellers have accumulated positions.
Consequently, I would prefer confirmation rather than anticipation.
A decisive hold above approximately $4,600–$4,646, particularly if accompanied by supportive correlations, would provide considerably more information than simply buying because price has reached $4,600.
Why I Would Also Be Cautious Selling
The opposite argument is equally important.
Gold’s underlying technical condition has improved.
Price has reclaimed significant moving-average structures, and the recovery from the recent low has been powerful. Selling aggressively into strengthening momentum can become dangerous if resistance converts into support.
There is also the possibility of a short squeeze.
If traders establish substantial short exposure around an obvious psychological level such as $4,600 and Gold subsequently breaks through approximately $4,646, forced exits and momentum buying could accelerate the move.
That could expose higher areas such as:
$4,669 → $4,747 → $4,838 → $4,937 → $5,000+
These are scenario levels rather than guaranteed targets, but they demonstrate why blindly selling a resistance zone can be as dangerous as blindly buying into one.
Correlations: The Most Important Confirmation Layer
Gold should never be analyzed in complete isolation.
One of the central principles of the YAI methodology is that price tells us where the market is, correlation helps explain why it may be there, and reaction provides evidence about what could happen next.
Several markets deserve close attention.
DXY — US Dollar Index
The relationship between Gold and the US dollar is frequently inverse.
A sustained decline in DXY can improve the environment for XAU/USD because Gold becomes cheaper in other currencies and dollar-denominated assets face a weaker currency backdrop.
Therefore:
DXY ↓ → potentially supportive for Gold
DXY ↑ → potentially restrictive for Gold
But this relationship is not absolute. Divergences can persist, particularly when safe-haven flows or central-bank demand dominate.
US 10-Year Treasury Yield
Treasury yields are another critical variable.
Gold does not generate interest. When yields—particularly real yields—rise substantially, interest-bearing assets can become relatively more attractive. Falling yields can reduce that opportunity cost.
The analysis shows US10Y around the 4.70% region, which makes the yield reaction particularly important.
If Gold remains strong despite elevated yields, that itself is information: underlying Gold demand may be sufficiently powerful to offset part of the traditional yield pressure.
Real Yields
Nominal Treasury yields tell only part of the story.
Gold traders should also consider real yields, which adjust interest rates for inflation expectations.
Generally:
Real yields ↓ → supportive for Gold
Real yields ↑ → potential headwind for Gold
This relationship connects Gold directly to expectations surrounding inflation and Federal Reserve policy.
USD/JPY: A Valuable Secondary Confirmation
USD/JPY is another important component of the YAI correlation framework.
A falling USD/JPY can indicate strengthening yen and/or weakening dollar conditions. When this occurs alongside declining DXY and Treasury yields, the combined environment can provide stronger confirmation for Gold.
A sequence such as:
DXY ↓ + US10Y ↓ + USD/JPY ↓ → XAU/USD ↑
can represent a particularly constructive correlation structure.
However, correlation should be treated as confirmation—not an automatic trading signal.
XAU/XAG and Oil
The Gold/Silver ratio (XAU/XAG) provides another perspective on precious-metals positioning.
A declining ratio accompanied by rising Gold and Silver can suggest broad participation across precious metals. Conversely, an unusually strong Gold/Silver ratio may indicate that Gold is outperforming Silver, sometimes reflecting defensive or safe-haven positioning.
Oil introduces an additional macroeconomic dimension.
Higher crude prices can increase inflation concerns. That can support Gold through inflation-hedging demand, but it can simultaneously push yields higher if markets expect tighter monetary policy.
Therefore, oil’s effect is rarely one-dimensional.
Economics Behind the $4,600 Decision
The next major move in Gold is unlikely to depend on technical analysis alone.
XAU/USD remains highly sensitive to Federal Reserve expectations, inflation, employment, economic growth and geopolitical risk.
Traders should closely monitor:
FOMC decisions and minutes, CPI, Core CPI, PPI, PCE inflation, Nonfarm Payrolls, unemployment, retail sales, GDP, ISM data and Federal Reserve communication.
The important question is not simply whether economic data are strong or weak.
The real question is:
How does the new information change expectations for interest rates, Treasury yields and the US dollar?
For example, weaker economic data can increase expectations for easier monetary policy.
That can potentially produce:
Rate expectations ↓ → Treasury yields ↓ → DXY ↓ → Gold supported
Stronger-than-expected inflation, however, could revive expectations of tighter monetary conditions:
Inflation pressure ↑ → rate expectations ↑ → yields ↑ → potential Gold pressure
This transmission mechanism is one of the most important concepts for serious XAU/USD analysis.
Four Scenarios Around $4,600
Rather than committing to one prediction, YAI considers four broad possibilities.
A bullish breakout would require Gold to establish acceptance above the $4,600–$4,646 region while correlations remain supportive. Such confirmation could expose progressively higher resistance zones.
A liquidity sweep could occur if Gold briefly trades above the zone, attracts breakout buyers and triggers stops, but then rapidly falls back below it. That would warn of a false breakout and possible retracement.
A bearish rejection would become more relevant if Gold fails around resistance while DXY and yields strengthen.
Finally, consolidation between approximately $4,545 and $4,646 could indicate that neither side has established control. In such an environment, patience may provide a greater advantage than repeated entries.
The YAI Approach: Confirmation Before Conviction
At $4,600, the market does not need another prediction.
It needs observation.
Gold has recovered strongly enough that aggressive selling carries significant risk. Yet price has also reached a technically meaningful region where aggressive buying can offer poor risk-to-reward without confirmation.
That makes $4,600 a perfect example of the YAI philosophy:
PRICE tells us WHERE the market is.
CORRELATION helps explain WHY it may be there.
REACTION tells us WHAT COULD HAPPEN NEXT.
The professional approach is therefore to watch Gold’s reaction, DXY, Treasury and real yields, USD/JPY, XAU/XAG, macroeconomic expectations and liquidity behaviour together.
The objective is not to be bullish or bearish at all times.
The objective is to be prepared when probability, price and confirmation align.
YAI — Spot Gold XAU/USD
Liquidity • Structure • Volatility • Correlation • Probability • Execution
Yaipubi Chanu Official Website
Join the Yaipubi Chanu Community
Educational and research content only. XAU/USD is highly volatile, and leveraged trading can result in substantial losses. Technical levels, correlations and historical relationships are probabilistic and do not guarantee future price behaviour.