Trading major economic events such as the US Nonfarm Payrolls report is not simply about predicting whether the data will be strong or weak. My approach is to identify important price zones before the event, then study how macroeconomic data, liquidity, Treasury yields, the US Dollar and market positioning interact when price reaches those areas.
The latest NFP session provided an important example.
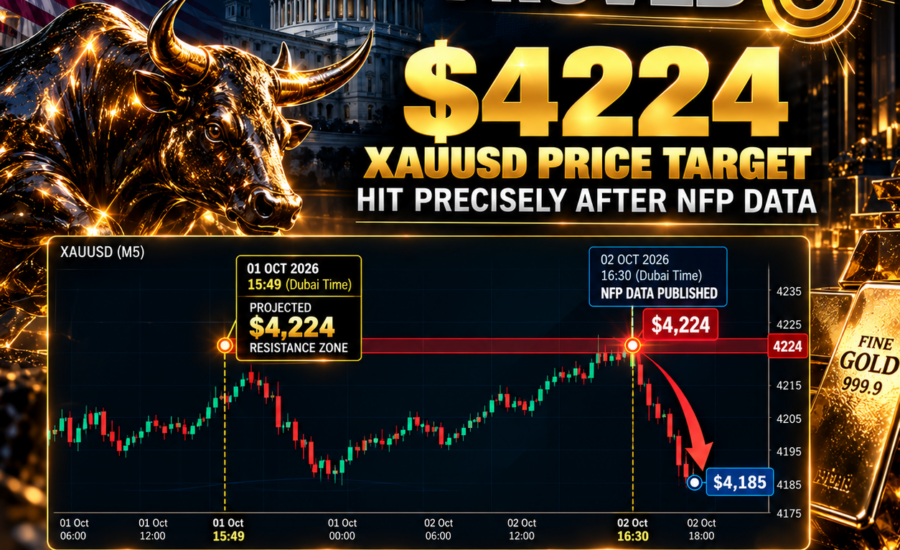
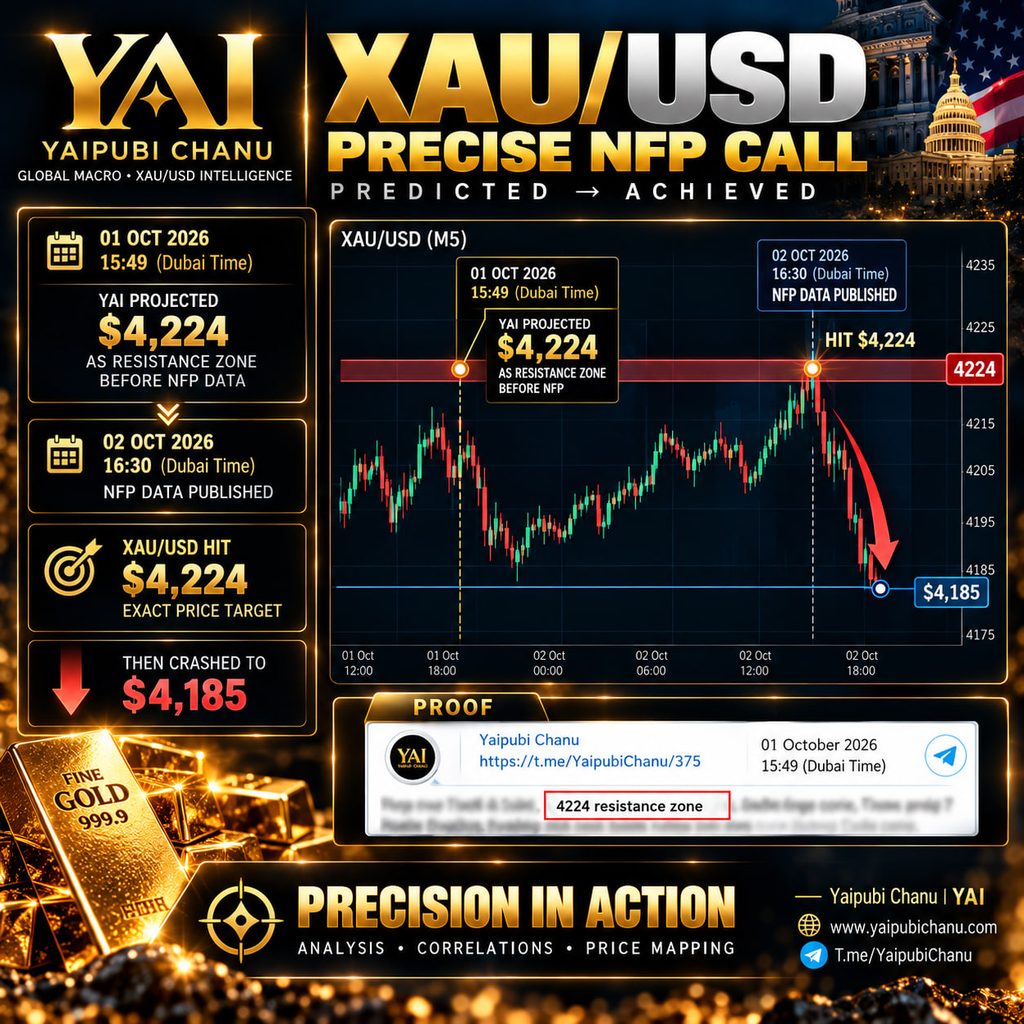
On 1 October 2026 at 15:49 Dubai time, approximately one day before the scheduled NFP release, I published $4,224 as an important XAU/USD resistance zone for my community.
The reference was published publicly on Telegram before the event:
YAI Telegram Post #375:
View the original pre-NFP post
The following day, after the US employment data was released, XAU/USD advanced to $4,224, tested the projected resistance area and subsequently reversed toward approximately $4,185.
For me, the important point is not simply that $4,224 was reached. The more interesting question is why a price level identified before NFP became relevant when the fundamental catalyst arrived.
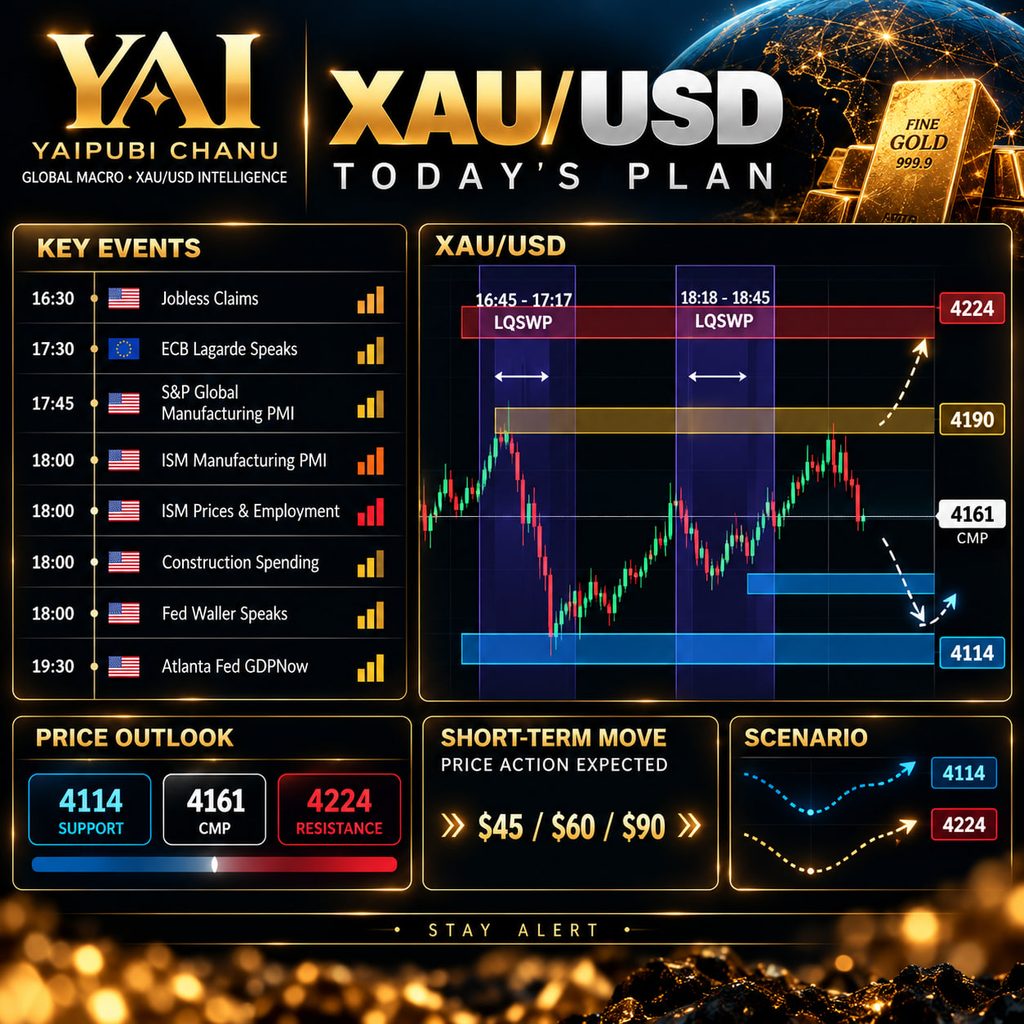
The $4,224 Pre-NFP Projection
Before a high-impact event, I prefer to create a map rather than attempt to predict every candle.
My framework separates the analysis into two questions:
Where could price travel?
And:
What macro conditions could drive it there?
The first question involves technical structure, liquidity, historical price behaviour and quantitative levels. The second requires monitoring economic data and the correlations between Gold, Treasury yields, the Dollar and broader markets.
Before NFP, $4,224 was identified as resistance rather than as a random upside target.
This distinction matters.
A target tells me where price could potentially travel. A resistance zone tells me to pay close attention to how price behaves after arriving there.
If price reaches a projected resistance level but breaks decisively through it, the next upside zone becomes relevant. If price reaches the level and fails to establish acceptance above it, the probability of a retracement increases.
That is why I prefer price maps over one-direction forecasts.
NFP Arrives
The US employment report was scheduled for 2 October 2026 at 16:30 Dubai time.
NFP is one of the most closely watched macroeconomic releases for Gold because employment conditions can influence expectations surrounding Federal Reserve monetary policy.
However, I do not interpret NFP through the headline payroll number alone.
My preferred sequence is:
NFP → Fed Expectations → US Treasury Yields → DXY → XAU/USD
Employment growth, unemployment and wage inflation collectively influence how markets interpret the likely path of US interest rates.
If the labour market weakens materially, markets can price a less restrictive Federal Reserve path. Treasury yields and the Dollar may then weaken, which can support Gold.
Conversely, stronger employment or wage inflation can reinforce expectations for restrictive monetary policy, potentially supporting yields and the Dollar and creating pressure on XAU/USD.
But the first market reaction is not always the final reaction.
Why Correlations Matter More Than the First Candle
This is one of the most important lessons I have learned from studying XAU/USD around major economic releases.
The data release creates information.
The market then has to price that information.
That repricing occurs across multiple markets simultaneously.
Treasury yields move. DXY reacts. USD/JPY can respond to changes in US-Japan yield expectations. Equity markets adjust. Algorithmic systems execute orders. Liquidity around obvious highs and lows is consumed.
Gold sits inside this entire network.
This is why I continuously monitor:
US2Y • US10Y • US30Y • DXY • USD/JPY • Oil • Fed Expectations • Liquidity • XAU/USD
A trader looking only at the NFP headline may see one story.
A trader looking at the entire correlation structure may see something very different.
$4,224 Is Reached
Following the NFP event, XAU/USD moved upward and eventually traded at the $4,224 resistance area that had been identified before the release.
This was the moment when the pre-event price map became especially important.
Instead of assuming that an upward move must continue indefinitely, I was watching whether Gold could establish itself above the resistance zone.
It failed to sustain the move and subsequently reversed.
XAU/USD moved from approximately:
$4,224 → $4,185
That represents roughly a $39 retracement from the projected resistance area.
For my research, this sequence is significant because the level was documented before the economic catalyst, rather than identified retrospectively after observing the price movement.
Forecasting a Zone Is Different From Predicting the News
There is an important distinction here.
I am not claiming that a technical level predicts what the NFP number itself will be.
That is not the purpose of my methodology.
Instead, I am trying to determine where price could encounter meaningful liquidity or structural resistance once the fundamental information enters the market.
Fundamentals can provide the catalyst.
Liquidity can determine the speed.
Correlations can determine whether the move is sustainable.
Price structure can identify where the market may react.
This creates the framework I use:
DATA → CORRELATIONS → LIQUIDITY → PRICE ZONES → EXECUTION
No individual component is sufficient on its own.
Why I Prepare Before NFP
NFP volatility can be extremely fast.
Waiting until after the release to begin identifying important levels can leave traders reacting emotionally to candles that have already moved significantly.
My preference is therefore to map several possibilities beforehand.
For this NFP structure, my broader upside map included:
$4,224 → $4,237 → $4,257 → $4,269 → $4,303
Each level represented a different stage of potential continuation.
Likewise, retracement areas remained important if the initial rally failed.
The objective was never to assume every upside level would automatically be reached. The objective was to know what to watch next as price moved through the structure.
Once $4,224 was tested and rejected, the character of the move changed.
The Importance of Timestamped Analysis
There is a major difference between explaining a market move afterward and documenting a price level beforehand.
After an event, almost any movement can be explained using some combination of inflation, employment, yields, liquidity, geopolitics or positioning.
That is why I place considerable importance on timestamped analysis.
A timestamp allows readers to distinguish between:
pre-event analysis and post-event explanation.
The $4,224 resistance reference was publicly posted before NFP, providing a record against which the subsequent market behaviour can be compared.
One successful level does not establish the future accuracy of a methodology, and historical reactions never guarantee that the same structure will work again. The useful approach is to evaluate a sufficiently large sample of timestamped projections and measure how consistently projected zones interact with subsequent price action.
That is the standard I want my research to move toward.
My Takeaway From This NFP
The lesson from this session is not simply:
“$4,224 was achieved.”
The larger lesson is that preparation can be more valuable than prediction.
Before major data, I want to know my important resistance levels, support zones, liquidity areas and macro correlations.
Then I allow the market to reveal which scenario is actually developing.
For this NFP sequence, the documented structure was clear:
Pre-NFP projection: $4,224 resistance
NFP event: 2 October 2026
XAU/USD: $4,224 achieved
Subsequent retracement: approximately $4,185
For me, this is another case study in combining macroeconomics, correlations, liquidity analysis and quantitative price mapping rather than relying on the economic headline alone.
Markets will always contain uncertainty. No level is guaranteed, and no correlation works perfectly on every occasion.
But uncertainty does not prevent preparation.
That remains the foundation of my approach to Gold:
Map the levels before the event.
Track the correlations when the data arrives.
Observe how price behaves at the projected zones.
And most importantly, let the market confirm the analysis rather than forcing the market to agree with it.
— Yaipubi Chanu | YAI
www.yaipubichanu.com
T.me/YaipubiChanu