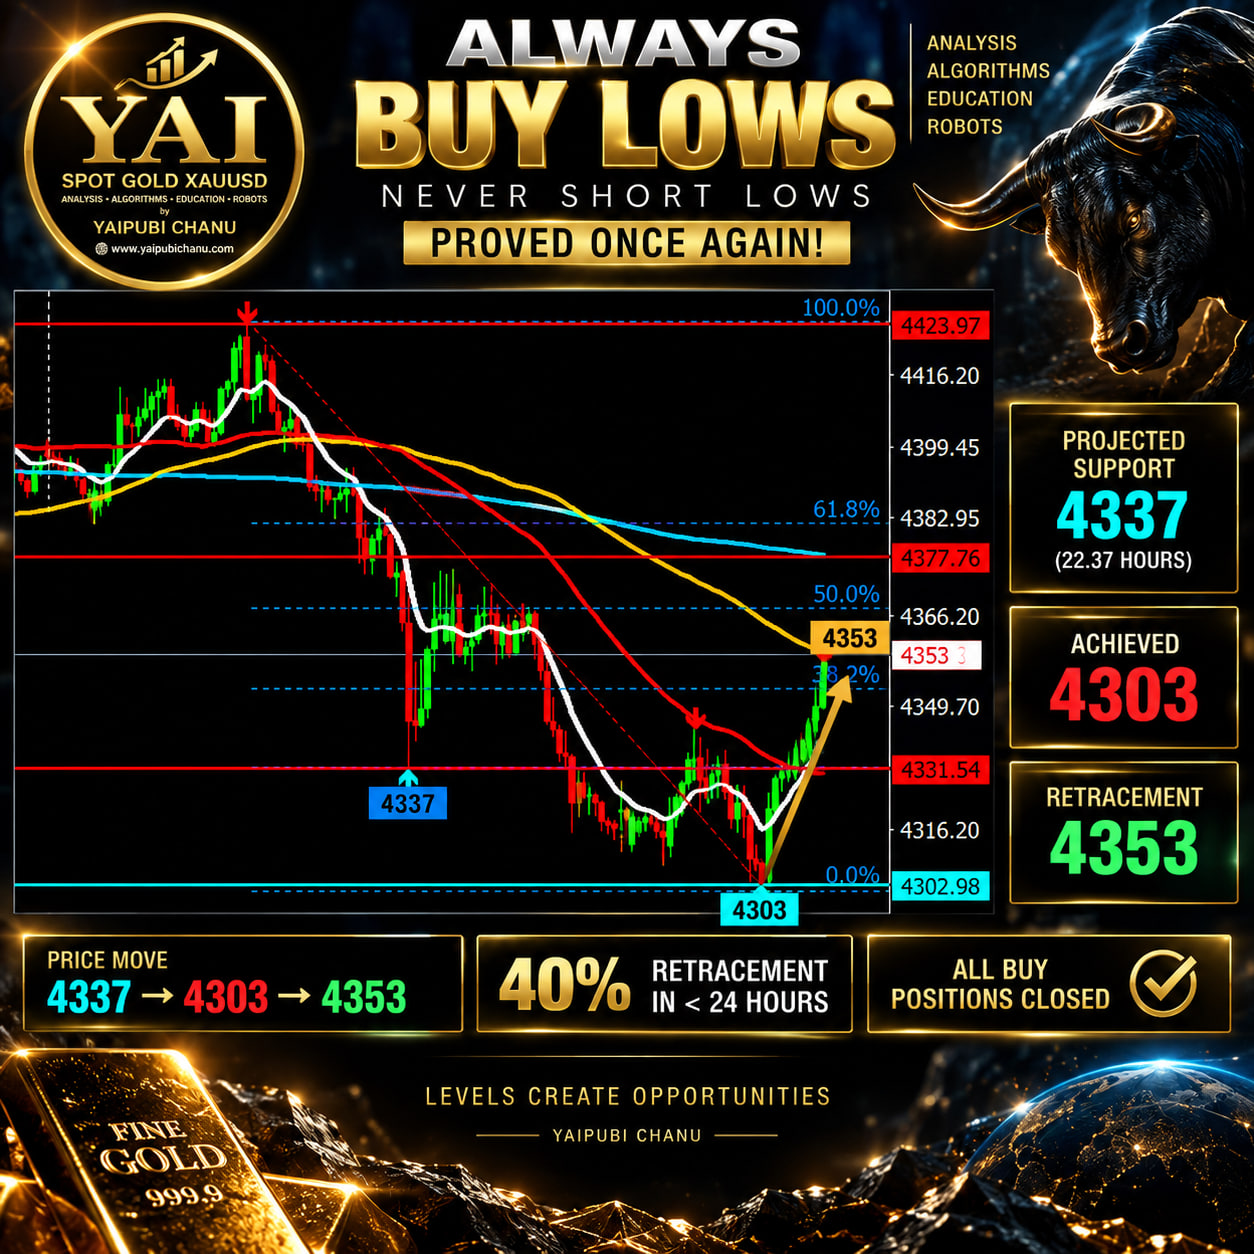
Always Buy Lows, Never Short Lows: Proved Once Again
By Yaipubi Chanu | YAI — Spot Gold XAU/USD
The latest US Producer Price Index session provided another example of why I prefer to prepare XAU/USD price zones before major economic releases rather than react emotionally after volatility has already arrived. My objective before PPI was not to predict every candle or chase Gold as it fell. I wanted to identify where selling pressure could eventually meet an important buying area and then evaluate whether the surrounding correlations supported a recovery.
My buying-zone framework brought the $4,337 region into focus before the decline. Gold subsequently broke beneath this area during the volatility, extended to approximately $4,303, and then recovered. Today, XAU/USD advanced from $4,303 to around $4,360, representing a recovery of approximately $57 from the low.
For me, the important part is not simply the $57 move. It is the sequence: projection → volatility → liquidity sweep → correlation assessment → recovery.
Why PPI Mattered for Gold
PPI measures changes in the prices received by US producers for their output. Although CPI receives greater attention from many traders, PPI can provide an important signal about inflationary pressure earlier in the production chain.
For Gold, however, the number itself is only the beginning.
My framework follows the transmission mechanism:
PPI → inflation expectations → Federal Reserve expectations → Treasury yields → real yields → US Dollar → XAU/USD.
A hotter inflation signal can encourage markets to price a more restrictive Federal Reserve path. If Treasury and real yields subsequently rise and the Dollar strengthens, Gold can come under pressure because a non-yielding asset becomes relatively less attractive.
A softer inflation picture can produce the opposite repricing.
But these relationships are conditional rather than mechanical. That distinction is central to how I trade economic releases.
My Correlation Framework Before PPI
Before PPI, I was not looking at XAU/USD in isolation. I was watching the broader macro complex, particularly US10Y Treasury yields, real yields, DXY and USD/JPY, while also using XAU/XAG and crude oil as secondary information.
The question was not simply:
“Will PPI be good or bad for Gold?”
The more useful questions were: How are yields positioned before the release? Is DXY confirming the move? Is USD/JPY moving consistently with the rates market? Is Gold already stretched away from its short-term structure? And most importantly, where are my predetermined buying zones if volatility creates a liquidity sweep?
This is why I prefer levels first and narratives second.
If the macro reaction pushes Gold downward into a price zone I have already identified, I can evaluate the opportunity with considerably more discipline than if I simply chase the first post-data candle.
PPI Arrived — Then Gold Repriced
The PPI release created significant volatility in XAU/USD.
As selling accelerated, the previously identified $4,337 area came into play. Gold did not immediately stop there. Instead, the move extended lower toward $4,303.
This is an important lesson in how I define a buying zone.
A projected support level is not a guarantee that price must reverse to the exact dollar. During high-impact economic events, liquidity can disappear quickly, spreads can expand, stop orders can cascade and algorithmic execution can temporarily drive price beyond an obvious technical level.
That extension is exactly why risk management and confirmation remain essential.
I do not view a temporary break beneath a projected level as automatically invalidating the entire structure. I assess what happens after the liquidity event and, crucially, whether the correlations continue confirming the downside.
Why Correlations Matter After the Release
The minutes immediately following PPI can be very different from the market that develops afterward.
The initial reaction is driven by the surprise relative to expectations. The second phase is driven by interpretation.
That difference matters enormously.
If Gold is falling while US10Y rises, real yields rise and DXY strengthens, the decline has stronger macro confirmation. I become considerably more cautious about assuming that a low is complete.
But suppose Gold crashes into a major buying area and then the correlations stop extending. Treasury yields stabilize, DXY loses momentum, USD/JPY stops confirming the initial move, and Gold begins reclaiming short-term technical levels.
The situation changes.
What initially looked like a continuing bearish repricing can become a liquidity sweep followed by mean reversion or retracement.
That is why I never want to base an XAU/USD decision on PPI alone.
From $4,303 to $4,360
After reaching approximately $4,303, Gold began recovering.
The move back toward $4,360 produced approximately $57 of upside from the low. More importantly for my framework, price began retracing a meaningful portion of the PPI-driven decline.
The sequence became:
$4,337 projected support → $4,303 volatility low → $4,360 recovery.
This is the type of price behaviour I specifically look for around high-impact events. Instead of shorting Gold after a large decline has already occurred, my preference is to identify strategically important lows and then look for evidence that selling pressure is becoming exhausted.
This is the philosophy behind my approach:
Do not short the low simply because the chart looks bearish. Prepare to buy strategically selected lows when structure and confirmation support the opportunity.
The Importance of Retracement
A recovery after a major economic-data crash should not automatically be interpreted as the beginning of a new bullish trend.
It may initially be only a retracement.
That distinction keeps my analysis disciplined.
After the $4,303 low, I watched the recovery through the short-term retracement structure rather than immediately assuming Gold would return to its pre-PPI price. Reclaiming areas around $4,337, $4,350 and $4,360 progressively showed that buyers were absorbing part of the preceding selling pressure.
From there, the next question is whether Gold can continue reclaiming higher technical and correlation levels or whether sellers return.
I therefore treat every recovery as a developing structure—not as proof that the market must continue upward indefinitely.
What This PPI Session Reinforced for Me
This session reinforced a principle that sits at the centre of my YAI methodology:
Economic data creates volatility; price zones identify location; correlations provide context; confirmation determines execution.
I do not want to trade merely because PPI is hot or soft.
I want to understand what PPI does to Fed expectations, US10Y, real yields, DXY and USD/JPY, and then compare that macro reaction with the XAU/USD structure I mapped before the announcement.
The process is:
DATA → REACTION → CORRELATIONS → PRICE ZONE → CONFIRMATION → EXECUTION.
That sequence helps prevent one of the most common mistakes around economic releases—entering after the largest move has already happened simply because the direction suddenly appears obvious.
Conclusion
The move from $4,303 to $4,360 was significant because it followed a PPI-driven selloff into an area I had already been monitoring for buying opportunities.
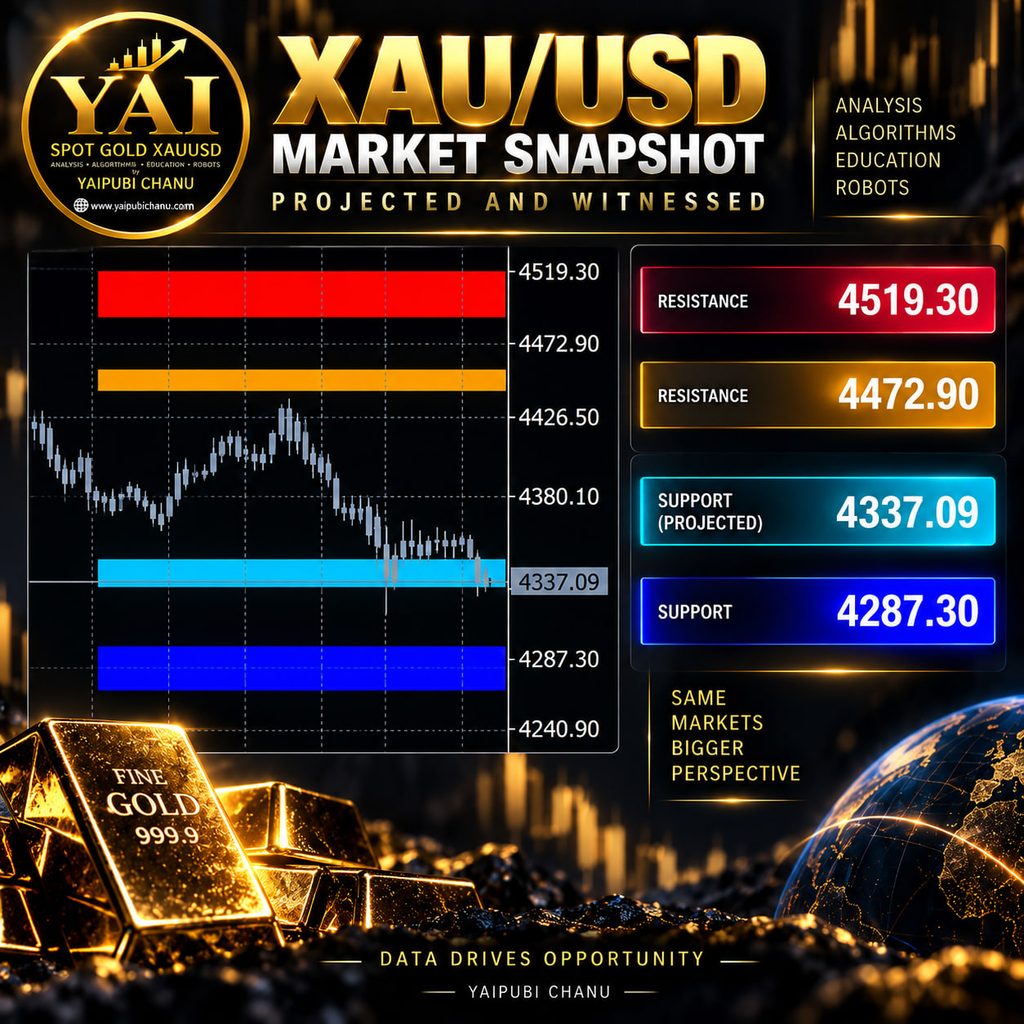
My analysis was never based on the assumption that Gold could not fall below $4,337. Yesterday at 22:37 hours, I projected $4,337 as an important XAU/USD support zone VERIFY HERE. Gold subsequently declined through the level, reaching $4,303, before delivering a powerful recovery toward $4,353 in less than 24 hours.
That remains my approach to XAU/USD.
I would rather prepare for the low than chase the crash.
Know the data. Map the levels. Track the correlations. Wait for confirmation. Execute with discipline.
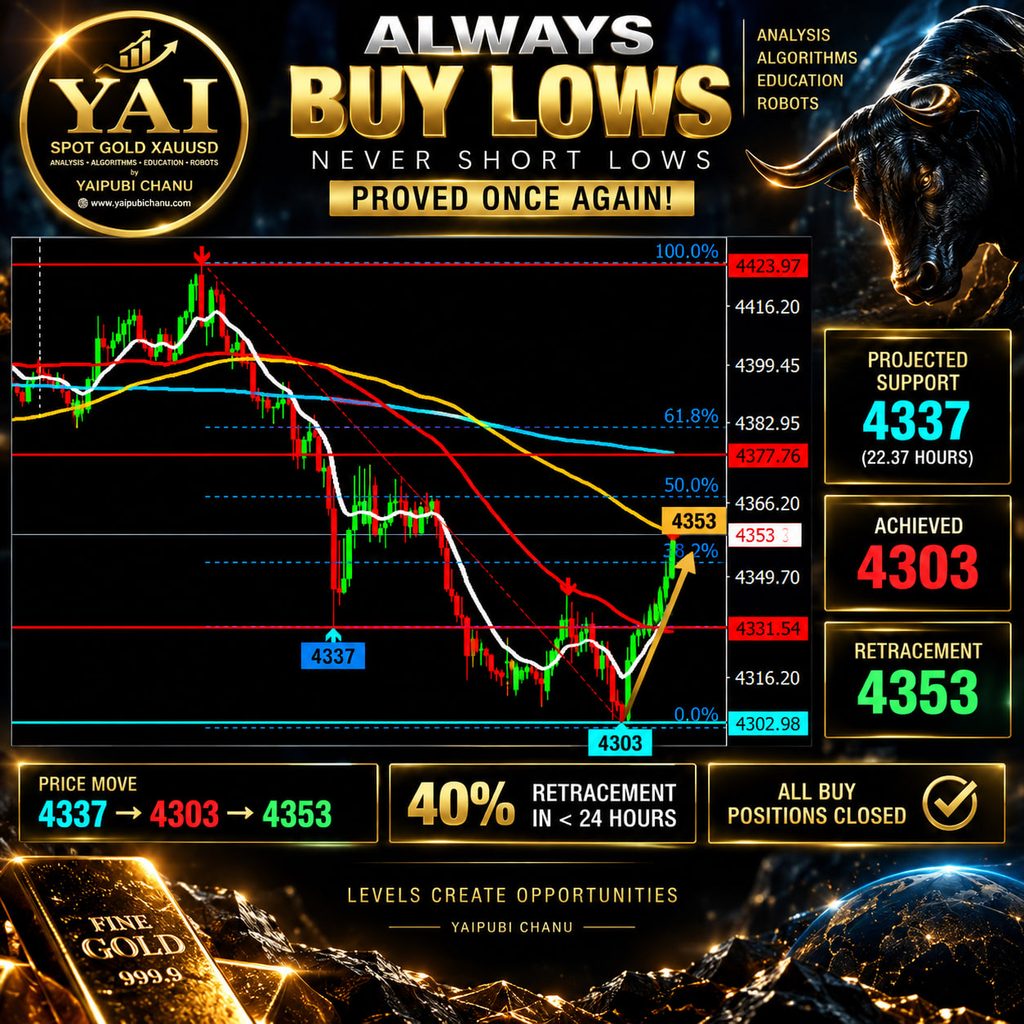
Price sequence: $4,337 → $4,303 → $4,353.
The recovery completed approximately a 40% retracement of the preceding decline, allowing all BUY positions to be closed.
This is why my approach remains focused on identifying strategic lows rather than chasing falling prices.
Know the level. Wait for confirmation. Execute with discipline.
— Yaipubi Chanu | YAI