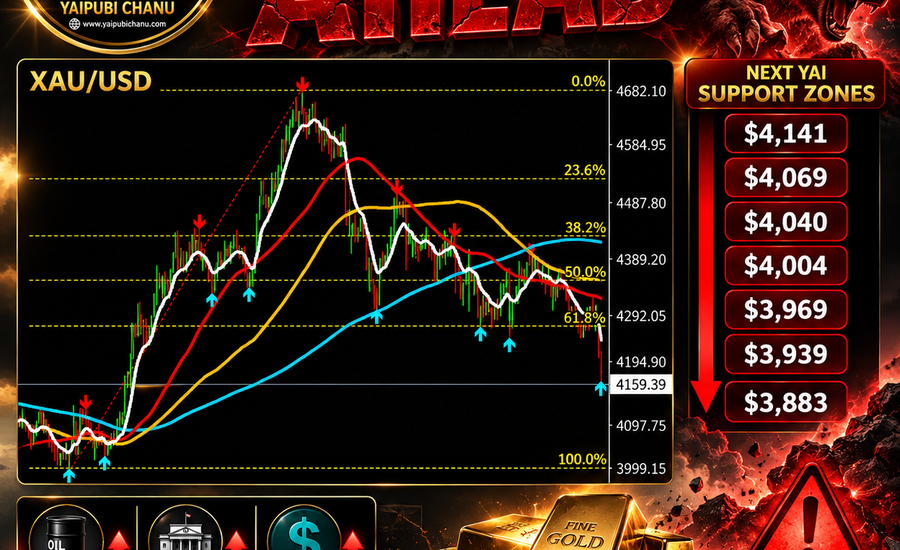
XAU/USD BELOW $4,224: WHY I AM WATCHING LOWER YAI SUPPORT ZONES INSTEAD OF SHORTING GOLD
Oil, Iran, Fed expectations, US yields and the Dollar are pressuring Gold — but one change in correlations could trigger a sharp recovery
By Yaipubi Chanu | YAI — Spot Gold XAU/USD
Gold Breaks Below My $4,224 Support Zone
Gold has broken below my important $4,224 YAI Support Zone, extending the recent decline in XAU/USD.
In my view, this move is easier to understand when we look beyond the Gold chart. Several markets are working together: Oil, US Treasury yields, the US Dollar and Federal Reserve rate expectations.
The basic economic relationship I am watching is:
Oil ↑ → Inflation Risk ↑ → Fed Rate Expectations ↑ → US10Y ↑ → DXY ↑ → XAU/USD ↓
This is one of the main reasons Gold can fall even when geopolitical uncertainty is high.
Why Iran and the Strait of Hormuz Matter
The situation between the United States and Iran remains extremely important for Gold.
The Strait of Hormuz is one of the world’s most important energy routes. Any development that affects the movement of Oil through the region can quickly influence global crude prices.
Normally, war and geopolitical uncertainty can increase demand for Gold as a safe-haven asset. But there is another side to this relationship.
If geopolitical tensions keep Oil prices high, markets may become more concerned about inflation.
That can create this chain:
Middle East Tensions ↑ → Oil ↑ → Inflation ↑ → US Yields ↑ → USD ↑ → Gold ↓
So, geopolitical tension does not automatically mean Gold must rise.
Gold Is Caught Between Two Opposing Forces
This is what makes the current market particularly interesting.
On one side:
Geopolitical Risk ↑ → Safe-Haven Demand ↑ → Gold ↑
On the other:
Geopolitical Risk ↑ → Oil ↑ → Inflation ↑ → Fed Hawkishness ↑ → Yields/USD ↑ → Gold ↓
At the moment, the second relationship has been an important source of pressure on XAU/USD.
But correlations can change quickly.
That is why I do not want to analyse Gold from only one headline or one technical indicator.
Why Federal Reserve Expectations Matter
The Federal Reserve is another major part of the equation.
When inflation remains high, markets can expect the Fed to maintain higher interest rates or become more hawkish.
Gold does not pay interest. Therefore, when Treasury and real yields rise, interest-bearing assets can become relatively more attractive.
In simple terms:
Fed Hawkishness ↑ → US Yields ↑ → DXY ↑ → Gold Pressure
This is why I continuously monitor US10Y and DXY alongside XAU/USD.
If Gold is falling while yields and the Dollar are rising, the correlation provides an economic explanation for the price movement.
Why Oil Is Important for My Gold Analysis
Oil has become particularly important because of the Middle East situation.
Higher Oil prices can increase transportation, manufacturing and energy costs throughout the economy. If those increases become persistent, they can make inflation more difficult for central banks to control.
That can affect Federal Reserve expectations.
So I am watching:
Oil → Inflation → Fed → US10Y → DXY → XAU/USD
Understanding this chain is more useful to me than simply saying, “war is bullish for Gold.”
Markets are more complicated than that.
Why US-Iran Talks Could Suddenly Change Gold’s Direction
There is also an important risk to the current bearish Gold structure: diplomacy.
If negotiations between the United States and Iran make meaningful progress and concerns surrounding the Strait of Hormuz decrease, Oil prices could potentially retreat.
Then the correlation could begin working in the opposite direction:
US-Iran De-escalation → Oil ↓ → Inflation Fears ↓ → US Yields ↓ → DXY ↓ → XAU/USD ↑
This is one reason I am very careful about opening SHORT positions after Gold has already experienced a substantial decline.
A geopolitical headline can change Oil, yields, the Dollar and Gold within a very short period.
Why I Am Not Shorting Gold at These Lows
My approach is simple:
I will not chase XAU/USD lower by SHORTING Gold at depressed prices.
That does not mean Gold cannot fall further.
It means I prefer to wait for my predefined YAI Support Zones and then study whether the macro correlations are beginning to support a potential BUY opportunity.
I want to see what happens to Oil, DXY, US10Y and USD/JPY as Gold approaches these levels.
If those correlations begin reversing, the probability of a Gold recovery may improve.
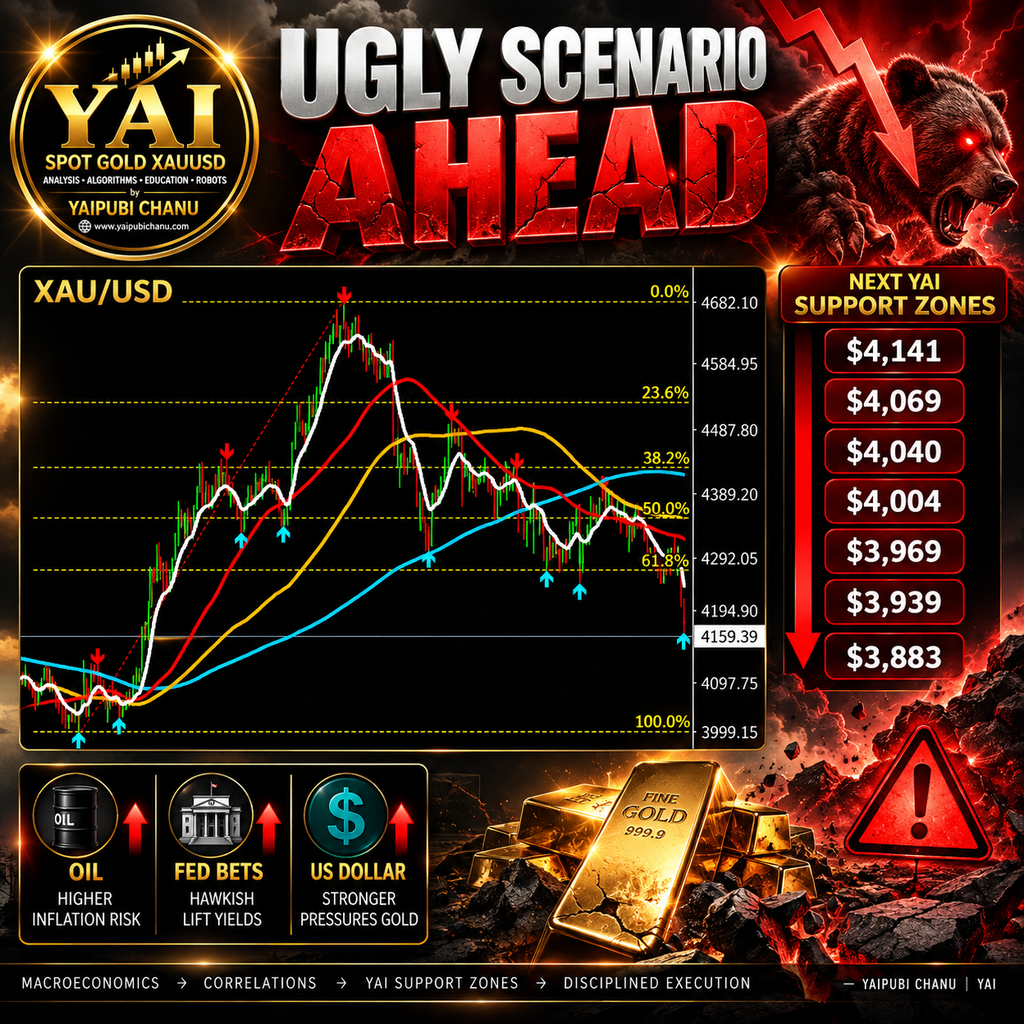
My Next YAI Support Zones
With $4,224 now broken, these are the next XAU/USD support zones on my radar:
$4,141 → $4,069 → $4,040 → $4,004 → $3,969 → $3,939 → $3,883
These levels should not be interpreted as a prediction that Gold must reach every zone.
They are simply predefined areas where I will pay closer attention to price action and correlations.
A support level alone is not enough for me. I prefer to see confirmation from the wider market.
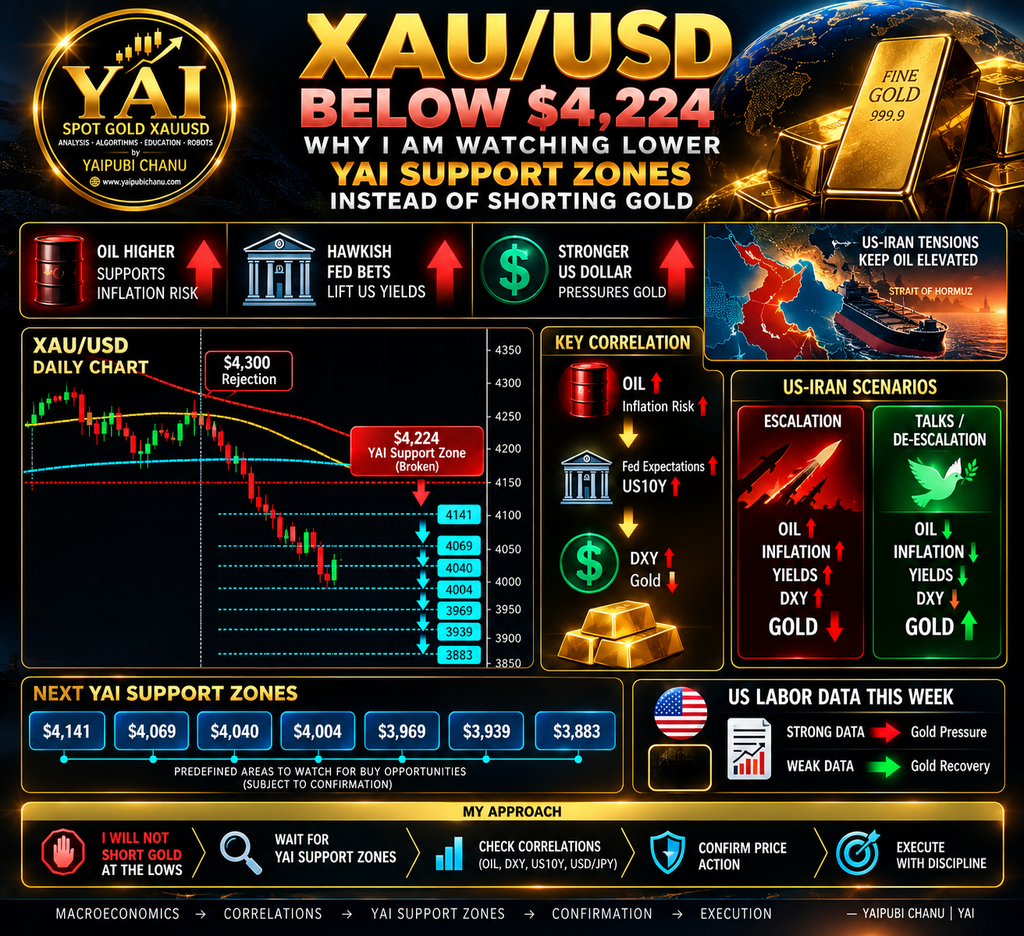
What Would Make Lower Gold Prices More Interesting to Me?
If XAU/USD moves toward these lower YAI Support Zones while DXY, US10Y and USD/JPY remain strong, Gold could continue facing pressure.
But if Gold reaches a major support area while Oil starts falling, Treasury yields weaken, DXY reverses and USD/JPY loses momentum, the situation becomes much more interesting.
My preferred sequence would therefore be:
YAI Support Zone reached → Correlations change → Price confirms → Execution
I do not want to BUY simply because a number appears on the chart. I want the broader market to support the decision.
US Labor Data Adds Another Major Variable
The next important factor is US labor-market data, particularly Nonfarm Payrolls (NFP).
Strong employment and wage data can reinforce expectations for tighter Federal Reserve policy.
That could produce:
Strong NFP → Fed Expectations ↑ → US10Y ↑ → DXY ↑ → XAU/USD ↓
Weak labor data could create the opposite reaction:
Weak NFP → Fed Expectations ↓ → US10Y ↓ → DXY ↓ → XAU/USD ↑
This means Gold traders now have to monitor both Middle East developments and US economic data.
My YAI Correlation Dashboard
For the next phase of XAU/USD, I am mainly watching these relationships:
Oil ↑ + US10Y ↑ + DXY ↑ → Pressure on Gold
USD/JPY ↑ → Potential additional pressure on Gold
Oil ↓ + US10Y ↓ + DXY ↓ → Better environment for Gold recovery
Geopolitical escalation → Safe-haven demand possible, but inflation risk also rises
US-Iran de-escalation → Oil pressure may ease → Gold reversal potential
None of these relationships works perfectly every day. Correlations strengthen and weaken as market expectations change.
That is exactly why I study them together.
My XAU/USD Roadmap
The break below $4,224 tells me that the current downside structure remains important.
My next YAI Support Zones are:
$4,141 → $4,069 → $4,040 → $4,004 → $3,969 → $3,939 → $3,883
I am not assuming that every level will be reached, and I am not assuming that every support will produce a reversal.
Instead, I will allow the market to come toward my levels and then study Oil, US10Y, DXY, USD/JPY, economic data and geopolitical developments for confirmation.
For me, successful Gold analysis is not about predicting every candle.
It is about understanding why Gold is moving, where important price zones are located and whether the correlations support the trade.
MACROECONOMICS → CORRELATIONS → YAI SUPPORT ZONES → CONFIRMATION → EXECUTION
I prefer to wait for Gold at my levels rather than chase Gold after the move has already happened.
— Yaipubi Chanu | YAI