XAU/USD September Cycle: My Six-Year View on Week 1–4, NFP and FOMC
By Yaipubi Chanu | YAI — Spot Gold XAU/USD
From my perspective at YAI — Spot Gold XAU/USD, September should not be viewed as one continuous trading month. It is better understood as a sequence of macroeconomic repricing phases. Over the last six completed years, from 2020 to 2025, I have observed that Week 1, Week 2, Week 3 and Week 4 often behave very differently, especially when NFP, inflation expectations, Treasury yields and the Federal Reserve begin influencing Gold together.
For this study, I define Week 1 as September 1–7, Week 2 as September 8–14, Week 3 as September 15–21, and Week 4 as September 22 to month-end.
Six-Year September XAU/USD Summary
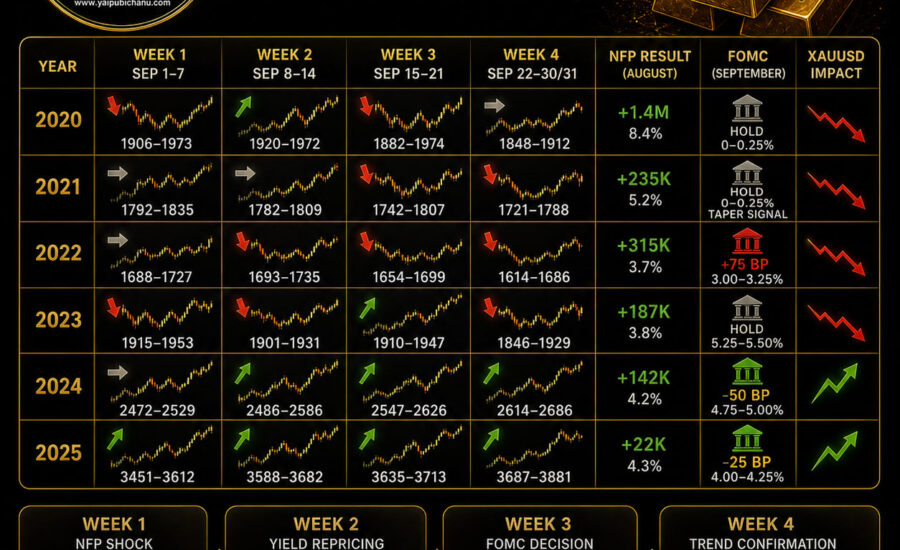
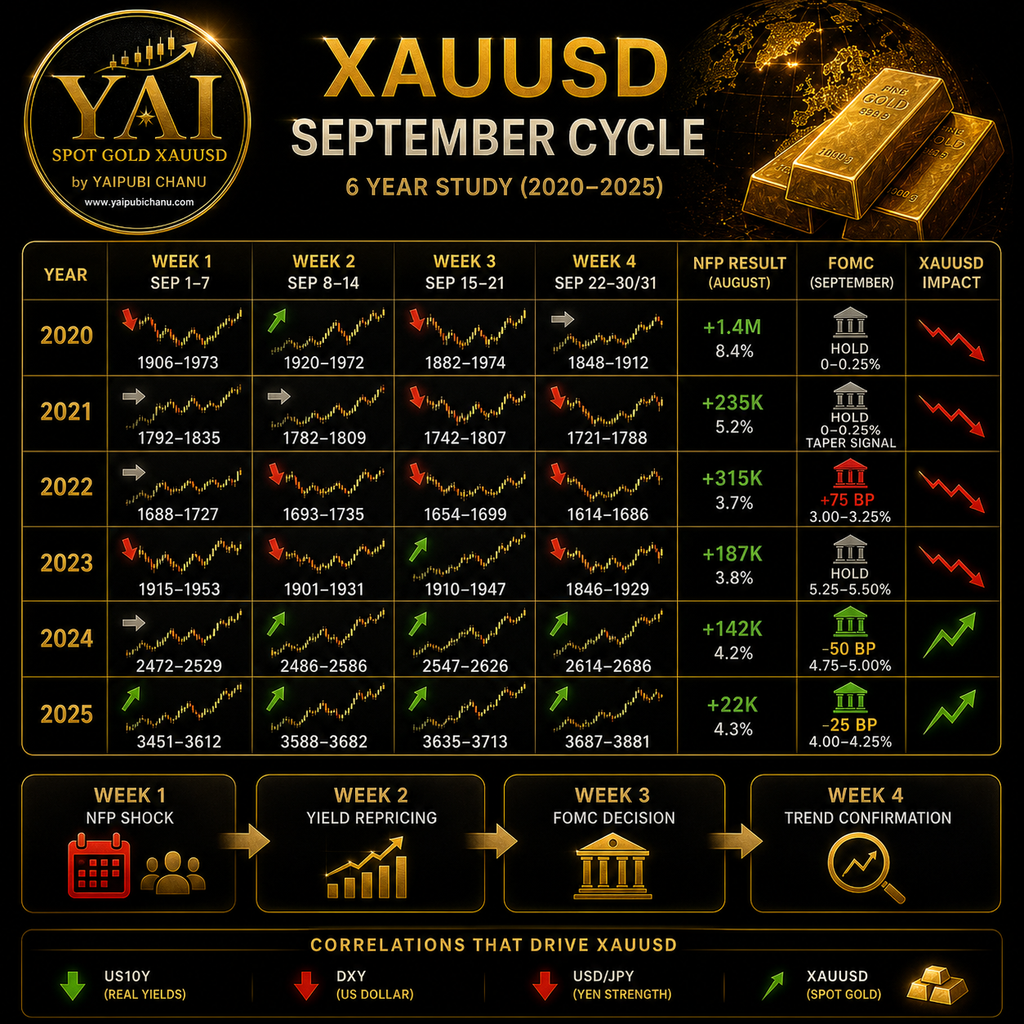
| Year | Week 1 | Week 2 | Week 3 | Week 4 | September NFP | FOMC | My Read on Gold |
|---|---|---|---|---|---|---|---|
| 2020 | $1,906–1,973 | $1,920–1,972 | $1,882–1,974 | $1,848–1,912 | +1.4M | Hold 0–0.25% | Early strength, then strong correction |
| 2021 | $1,792–1,835 | $1,782–1,809 | $1,742–1,807 | $1,721–1,788 | +235K | Hold 0–0.25% | Weak NFP helped briefly, but normalization pressure dominated |
| 2022 | $1,688–1,727 | $1,693–1,735 | $1,654–1,699 | $1,614–1,686 | +315K | +75 bp | Aggressive tightening kept Gold under pressure |
| 2023 | $1,915–1,953 | $1,901–1,931 | $1,910–1,947 | $1,846–1,929 | +187K | Hold 5.25–5.50% | Hawkish hold led to late-month weakness |
| 2024 | $2,472–2,529 | $2,486–2,586 | $2,547–2,626 | $2,614–2,686 | +142K | -50 bp | Beginning of easing cycle accelerated upside |
| 2025 | $3,451–3,612 | $3,588–3,682 | $3,635–3,713 | $3,687–3,881 | +22K | -25 bp | Weak labor market plus easing supported a major rally |
Week 1: I Focus First on the NFP Shock
The first week of September is important because this is usually where the August U.S. employment report resets expectations for the Federal Reserve.
I do not treat NFP as a simple bullish or bearish trigger for Gold. What matters to me is how the report changes rate expectations.
In 2020, NFP remained exceptionally strong as the economy recovered from pandemic disruptions. Gold remained volatile but struggled to sustain gains. In 2021, payroll growth weakened substantially, and Gold initially benefited. However, that move did not become a durable trend because the market was already shifting toward policy normalization.
The same principle appeared again in later years. In 2023, payroll growth slowed while unemployment moved higher. By 2024 and especially 2025, labor-market data had weakened further, creating a much more favorable environment for expectations of monetary easing.
From my perspective, this is why NFP should always be read together with:
US10Y → Real Yields → DXY → USD/JPY → XAU/USD
If weak NFP pushes Treasury yields lower and the Dollar also weakens, then the bullish signal for Gold becomes much stronger.
Week 2: The Market Decides Whether NFP Matters
Week 2 is where I watch whether the NFP reaction was genuine or temporary.
This is usually the stage where inflation expectations, CPI-related repricing, Treasury yields and Fed probabilities begin to challenge the first move.
A weak employment report can initially push Gold higher, but if inflation remains sticky and yields reverse upward, that bullish move can fade quickly.
This is why I avoid looking at Gold in isolation.
For me, the important question is not simply:
Was NFP weak?
The better question is:
Did weak NFP actually change the expected interest-rate path?
If the answer is no, the initial Gold reaction may not last.
Week 3: FOMC Becomes the Dominant Market Driver
In my view, Week 3 is often the most important week of September because this is where the Federal Reserve frequently delivers its policy decision.
The six-year comparison shows very different Gold outcomes depending on the monetary-policy regime.
In 2020, the Fed maintained rates near zero, but Gold still failed to sustain its earlier strength.
In 2021, rates were again unchanged, yet signals about tapering and normalization placed pressure on Gold.
The clearest example came in 2022. The Fed raised rates by 75 basis points, and Gold continued lower toward the $1,600 region.
In 2023, the Fed did not raise rates, but the meeting acted as a hawkish hold. This is an important concept in my analysis because a rate hold is not automatically bullish for Gold. If the Fed communicates higher-for-longer policy, yields can still rise and Gold can fall.
The regime changed dramatically in 2024 when the Fed cut rates by 50 basis points. Gold subsequently accelerated above $2,600.
In 2025, another 25-basis-point cut reinforced the easing cycle and helped maintain the broader bullish structure.
Week 4: I Look for Confirmation, Not Prediction
One of the strongest conclusions I draw from this study is that the first FOMC candle is often misleading.
The larger directional move may become clearer only in Week 4.
During 2020–2023, Week 4 repeatedly produced downside continuation or renewed selling pressure.
By contrast, 2024 and 2025 showed strong upside continuation after the Fed moved into an easing cycle.
This is why I prefer confirmation over prediction.
I want to know whether the markets surrounding Gold agree with the move.
If Gold rises while:
US10Y ↓
DXY ↓
USD/JPY ↓
the move has stronger macro confirmation.
If Gold rises while yields and the Dollar are also rising sharply, I become more cautious because correlations are no longer aligned.
What the Six-Year Study Tells Me
The biggest lesson for me is that September is not driven by one event.
It is a chain:
Week 1 — NFP shock
Week 2 — inflation and yield repricing
Week 3 — FOMC decision
Week 4 — trend confirmation or reversal
The period from 2020 through 2023 was largely dominated by normalization and tightening. Gold therefore faced repeated pressure during September.
The environment changed in 2024 and 2025 as monetary policy shifted toward easing. Gold responded with much stronger upside momentum.
This change in regime matters more to me than any individual economic headline.
A weak NFP does not automatically mean Gold must rise.
A rate cut does not guarantee an immediate rally.
A rate hold does not automatically mean Gold will fall.
What matters is how Treasury yields, the Dollar, USD/JPY and expectations for future Fed policy react together.
My YAI Approach for September
At YAI, I would treat September as a macro repricing window rather than a prediction contest.
I prefer to wait for price to approach important YAI Cluster Price Zones, then study whether correlations are confirming the setup.
My framework is therefore:
Know the level.
Watch the correlations.
Wait for confirmation.
Execute without emotion.
I also prefer to avoid chasing large NFP or FOMC candles immediately after release. These events can create rapid liquidity sweeps, reversals and false breakouts before the market establishes its genuine direction.
Conclusion
From my six-year study, September repeatedly produces one of the most important macro sequences for XAU/USD:
NFP → Treasury Yield Repricing → DXY / USDJPY Reaction → FOMC → Week-4 Confirmation
For 2026, I would therefore avoid trying to predict the whole month from a single NFP result.
Instead, I will continue to watch whether US10Y, DXY and USD/JPY confirm the movement in Gold, while using YAI Cluster Price Zones as the primary execution framework.
For me, the objective is not to capture every candle.
It is to identify the price level where macro, correlations and market structure converge.
YAI — Spot Gold XAU/USD
Analysis • Algorithms • Education • Robots
by Yaipubi Chanu