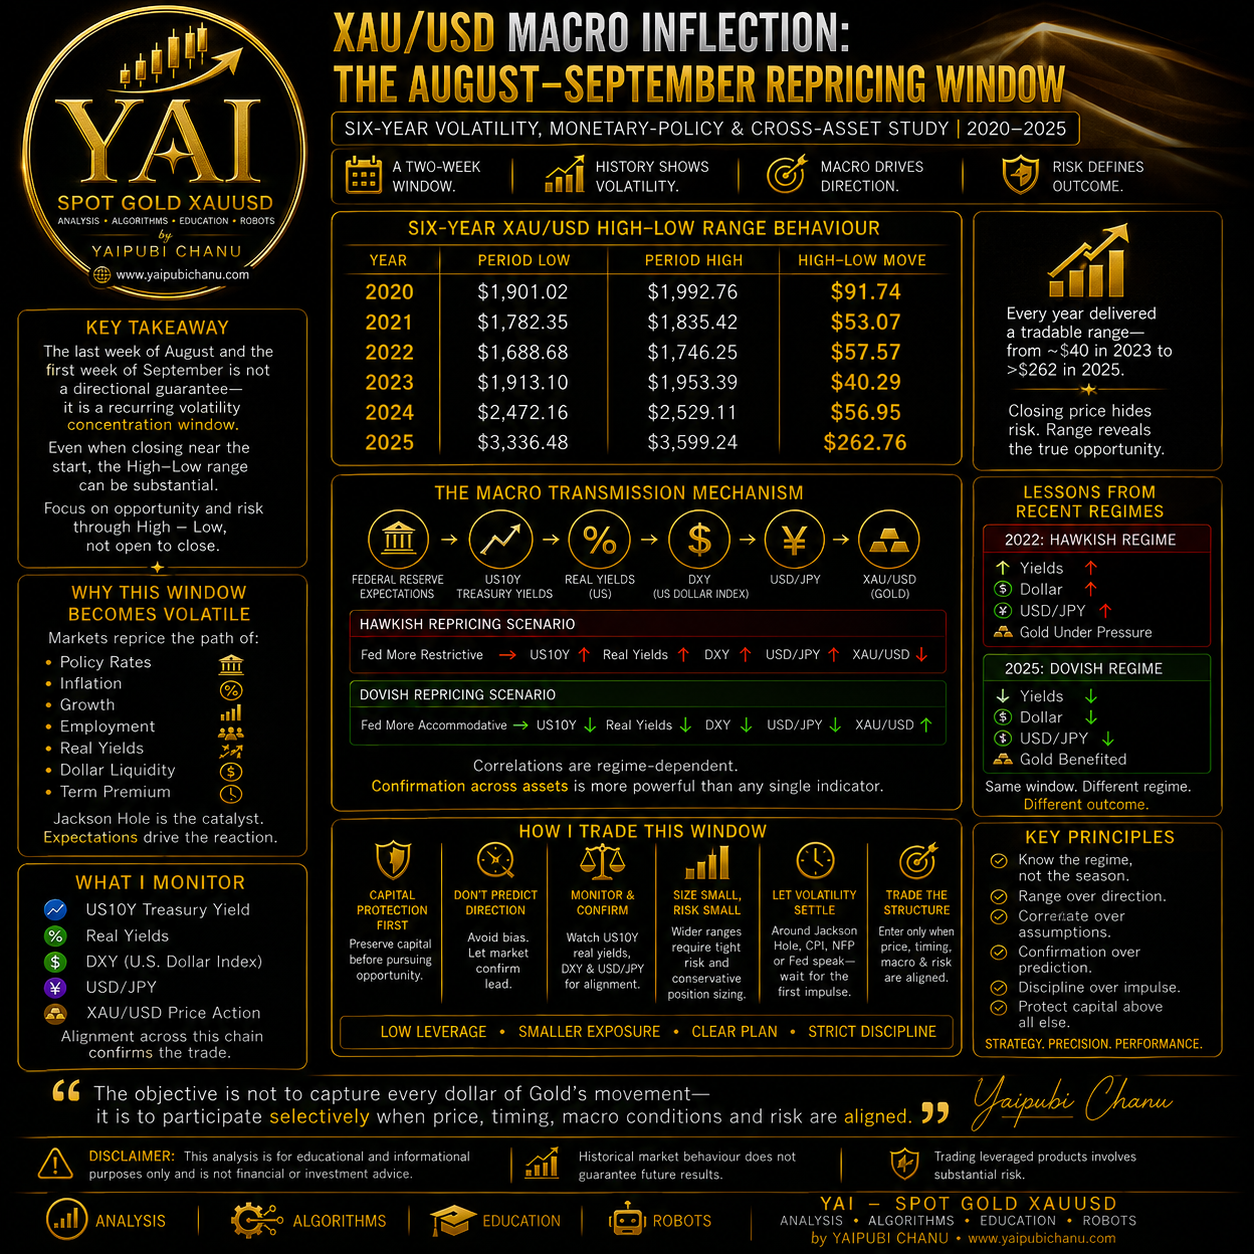
XAU/USD MACRO INFLECTION:
THE AUGUST–SEPTEMBER REPRICING WINDOW
Six-Year Volatility, Monetary-Policy & Cross-Asset Study | 2020–2025
By Yaipubi Chanu | YAI — Spot Gold XAU/USD
Analysis • Algorithms • Education • Robots
When monetary expectations shift, yields reprice, the Dollar reacts—and Gold enters a new volatility regime.
The transition from the final trading week of August into the first week of September represents a potentially consequential volatility regime for XAU/USD. I do not interpret this interval as a deterministic seasonal signal. Rather, I regard it as a recurring volatility-concentration window in which monetary-policy repricing, Treasury-market dynamics, dollar liquidity and portfolio rebalancing can collectively amplify Gold’s intraperiod price dispersion.
The distinction is important. Directional seasonality attempts to answer whether Gold should appreciate or depreciate. My framework instead asks a more relevant question:
How large is the market’s realized price excursion once macroeconomic expectations begin to reprice?
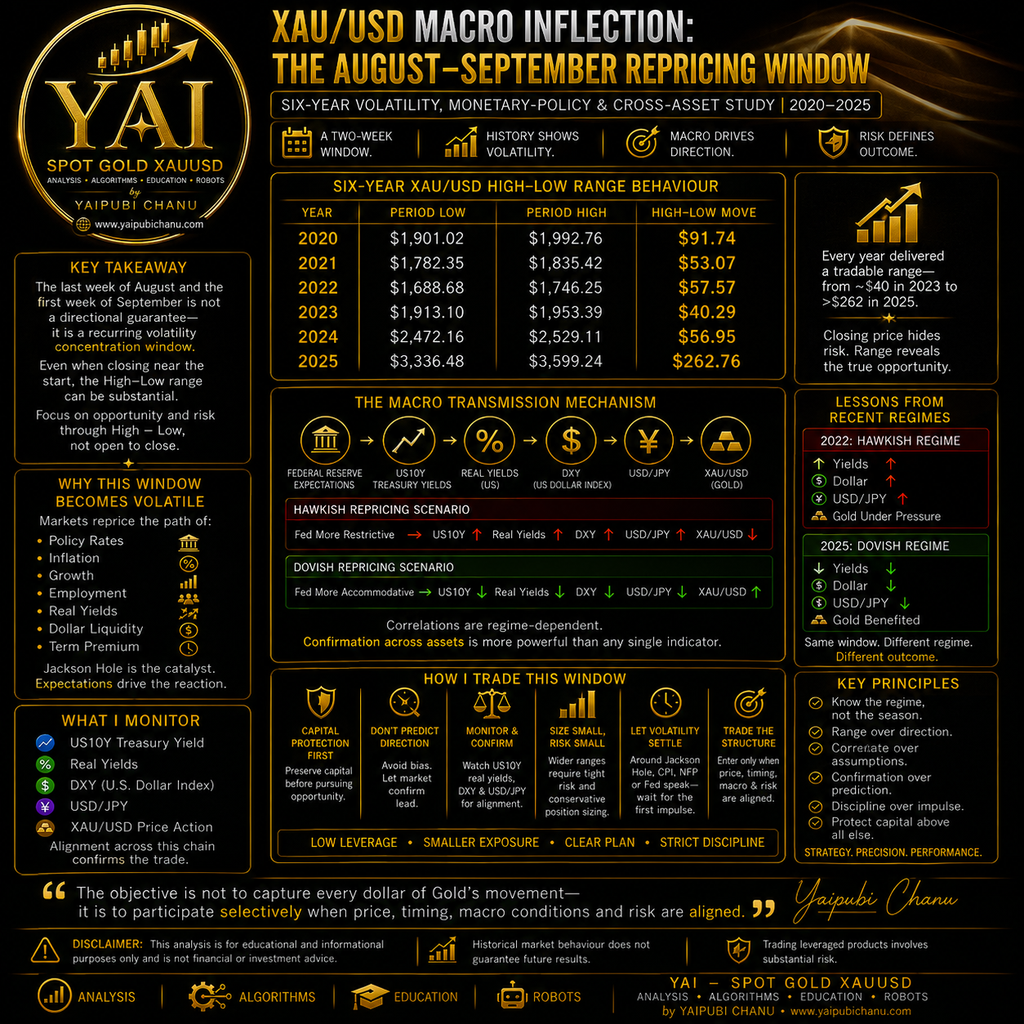
For this reason, the primary metric is High − Low, rather than the comparatively superficial difference between opening and closing prices.
Six-Year XAU/USD Range Behaviour
The 2020–2025 observations indicate substantial intraperiod dispersion:
| Year | Period Low | Period High | High–Low Range |
|---|---|---|---|
| 2020 | $1,901.02 | $1,992.76 | $91.74 |
| 2021 | $1,782.35 | $1,835.42 | $53.07 |
| 2022 | $1,688.68 | $1,746.25 | $57.57 |
| 2023 | $1,913.10 | $1,953.39 | $40.29 |
| 2024 | $2,472.16 | $2,529.11 | $56.95 |
| 2025 | $3,336.48 | $3,599.24 | $262.76 |
The economically relevant observation is not that every year generated an identical directional outcome. It is that every observation exhibited measurable range expansion, with the High–Low differential varying from approximately $40.29 in 2023 to $262.76 in 2025.
This dispersion demonstrates why closing-price analysis can materially understate the risk embedded within the period. A relatively modest net change can coexist with substantial two-way volatility, liquidity displacement and intra-window drawdown.
The Macroeconomic Transmission Mechanism
My analysis treats Gold as part of an interconnected macro-financial system rather than an isolated commodity.
The transmission sequence I monitor is:
Federal Reserve expectations → U.S. Treasury yields → Real yields → DXY → USD/JPY → XAU/USD
Gold is therefore evaluated through the interaction between nominal yields, inflation expectations, real interest rates, dollar valuation and global liquidity conditions.
A hawkish reassessment of the Federal Reserve’s reaction function can shift the expected trajectory of the policy rate upward. That repricing can increase Treasury yields and real yields, strengthen the U.S. Dollar and raise the opportunity cost associated with holding a non-yielding monetary asset such as Gold.
The simplified transmission mechanism becomes:
Fed repricing hawkish → US10Y ↑ → Real yields ↑ → DXY ↑ → XAU/USD ↓
Conversely, deterioration in macroeconomic data or a dovish reassessment of the policy path can compress expected rates and real yields:
Fed repricing dovish → US10Y ↓ → Real yields ↓ → DXY ↓ → XAU/USD ↑
These relationships are not mechanically constant. Correlation coefficients fluctuate according to the prevailing macroeconomic regime, which is precisely why cross-asset confirmation is more valuable than reliance on a single indicator.
Jackson Hole and the Expectations Channel
The late-August calendar is particularly significant because Jackson Hole can function as an expectations-reset mechanism for global financial markets.
Markets are not merely reacting to whether policymakers sound “hawkish” or “dovish.” They are continuously recalibrating the anticipated path of:
Policy rates • Inflation • Growth • Employment • Real yields • Term premium • Dollar liquidity
The economically significant variable is therefore the difference between the policy trajectory previously discounted by markets and the trajectory implied by incoming communication and data.
When the discrepancy becomes substantial, repricing can propagate simultaneously through Treasuries, foreign exchange, equities and precious metals.
Gold can consequently experience significant volatility even without an immediate alteration in the Federal Funds Rate.
Lessons From Previous Macro Regimes
The 2022 environment demonstrated how aggressive monetary tightening could generate a powerful cross-asset transmission mechanism. Restrictive Federal Reserve expectations contributed to higher Treasury yields, pronounced U.S. Dollar appreciation and substantial USD/JPY strength.
For Gold, the critical issue was not merely the nominal policy rate. It was the simultaneous repricing of real yields and the Dollar, both of which altered the relative attractiveness of non-interest-bearing assets.
By contrast, periods characterized by expectations of monetary accommodation can generate the inverse configuration. Declining Treasury yields, softer real-rate expectations and Dollar depreciation can reduce Gold’s opportunity cost and strengthen investment demand.
This explains why the same seasonal period can produce dramatically different directional outcomes while still exhibiting elevated volatility.
The 2026 Interpretation
For 2026, I would therefore avoid extrapolating previous August–September outcomes mechanically.
The correct question is not:
“What did Gold do last year?”
The relevant question is:
“Which macroeconomic variables are currently being repriced, and are Treasury, currency and Gold markets validating the same narrative?”
My preferred analytical hierarchy is:
US10Y → Real Yields → DXY → USD/JPY → XAU/USD
If these variables begin moving coherently, the probability that Gold is undergoing a genuine macroeconomic repricing becomes more significant.
If they diverge, I would treat the initial XAU/USD move with greater scepticism because it may represent liquidity displacement, stop-loss activity or short-duration positioning rather than a sustainable macro trend.
Trading the Volatility Regime
During the final week of August and opening week of September, my principal objective is preservation of capital and asymmetric risk deployment, not indiscriminate participation.
Historical range expansion implies that conventional position sizing can become disproportionately dangerous when realized volatility accelerates.
Accordingly, I would emphasize:
Lower leverage • Smaller nominal exposure • Wider analytical tolerance • Fewer correlated positions • Confirmation before execution
I would not establish directional exposure purely because historical seasonality appears bullish or bearish.
Instead, I would require corroboration from Treasury yields, real yields, DXY and USD/JPY, together with XAU/USD price structure.
Around Jackson Hole, inflation releases, NFP, Federal Reserve communication or Treasury-market disturbances, the initial candle can represent a liquidity shock rather than equilibrium price discovery.
Allowing the first repricing impulse to develop can therefore provide more information about whether the move is being validated by institutional cross-asset flows.
Conclusion
The 2020–2025 evidence suggests that the last week of August through the first week of September should be conceptualized as a volatility regime rather than a deterministic directional anomaly.
The historical High–Low dispersion demonstrates that the economic significance of this period lies primarily in the magnitude of price discovery—not simply whether Gold ultimately closes higher or lower.
My framework therefore remains:
Identify the volatility regime.
Observe the yield structure.
Measure Dollar repricing.
Track USD/JPY.
Validate through XAU/USD price action.
Deploy capital only when the variables converge.
The objective is not to forecast every fluctuation in Gold.
It is to distinguish macroeconomic repricing from market noise, identify when cross-asset relationships achieve sufficient confluence, and participate only when price, liquidity, monetary expectations, timing and risk asymmetry are simultaneously favourable.
Know the regime. Quantify the range. Validate the correlations. Protect capital.
— Yaipubi Chanu
YAI — Spot Gold XAU/USD
Analysis • Algorithms • Education • Robots
www.yaipubichanu.com
Disclaimer: This material is provided solely for educational and informational purposes and does not constitute investment, financial or trading advice. Historical price behaviour and statistical relationships do not guarantee future performance. Leveraged trading involves substantial risk, including the potential loss of capital.