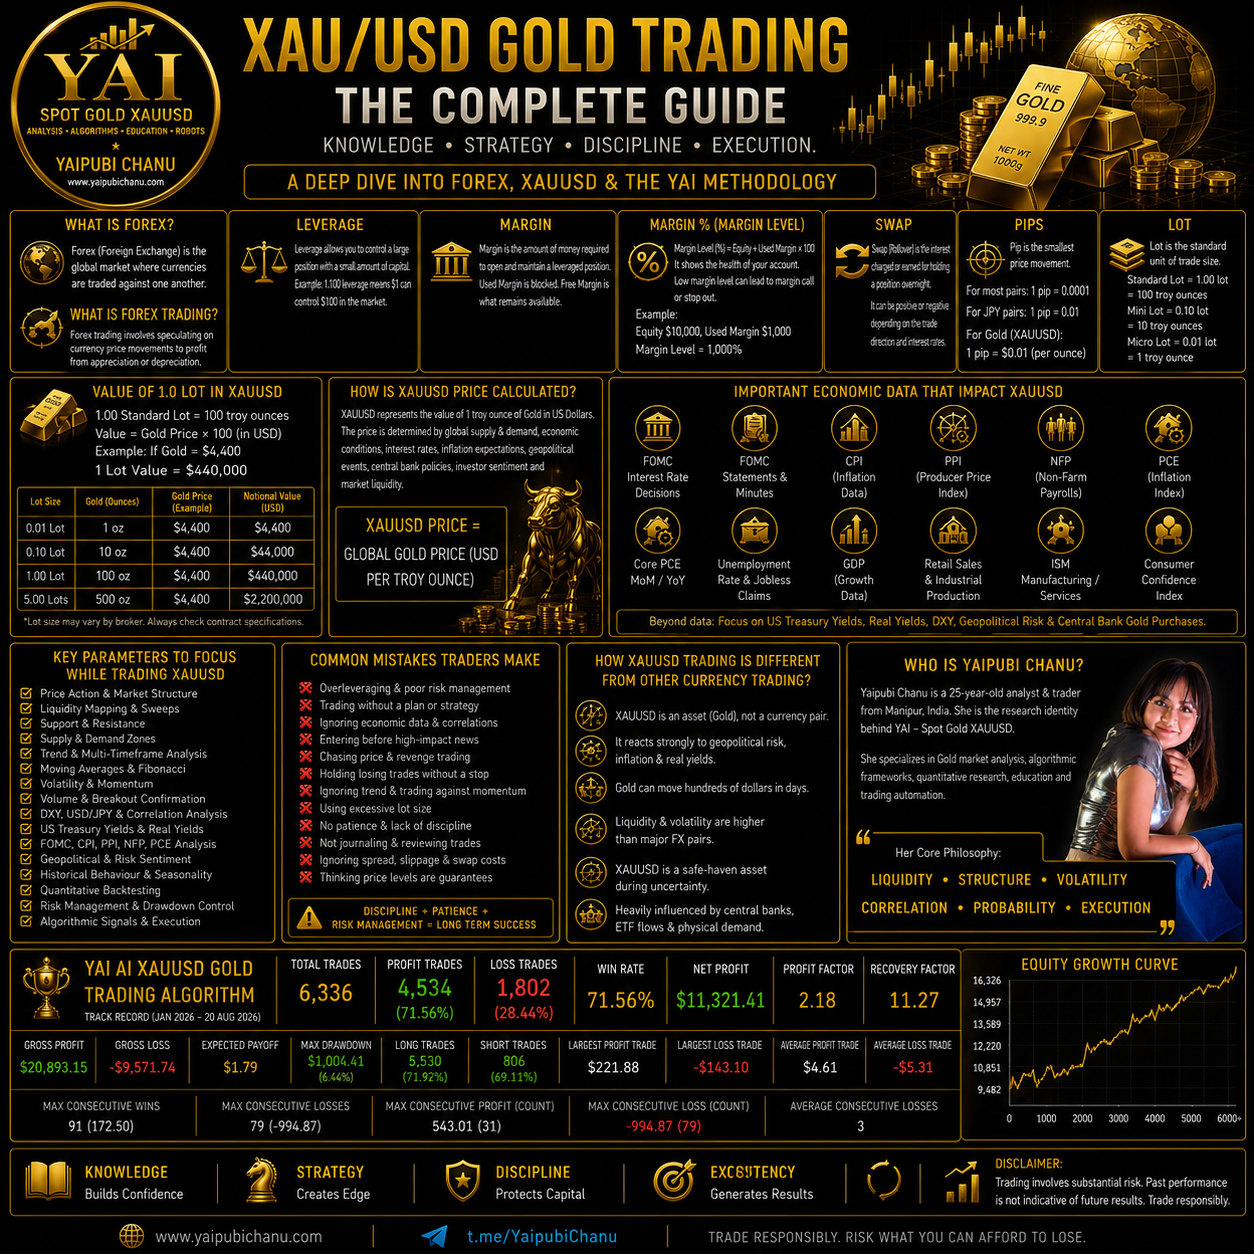
Understanding Forex and XAU/USD Gold Trading: A Practical Guide to Leverage, Margin, Pips, Lots, Economic Data and the YAI Methodology
Foreign exchange and Gold trading bring together macroeconomics, monetary policy, market psychology, leverage and technical analysis. Among leveraged instruments, XAU/USD — Spot Gold quoted against the US Dollar — is particularly important because it responds not only to ordinary technical price action but also to interest rates, Treasury yields, inflation expectations, geopolitical risk and global capital flows.
This guide explains the essential concepts a trader should understand before approaching XAU/USD and concludes with the methodology and reported trading statistics of Yaipubi Chanu and YAI — Spot Gold XAU/USD.
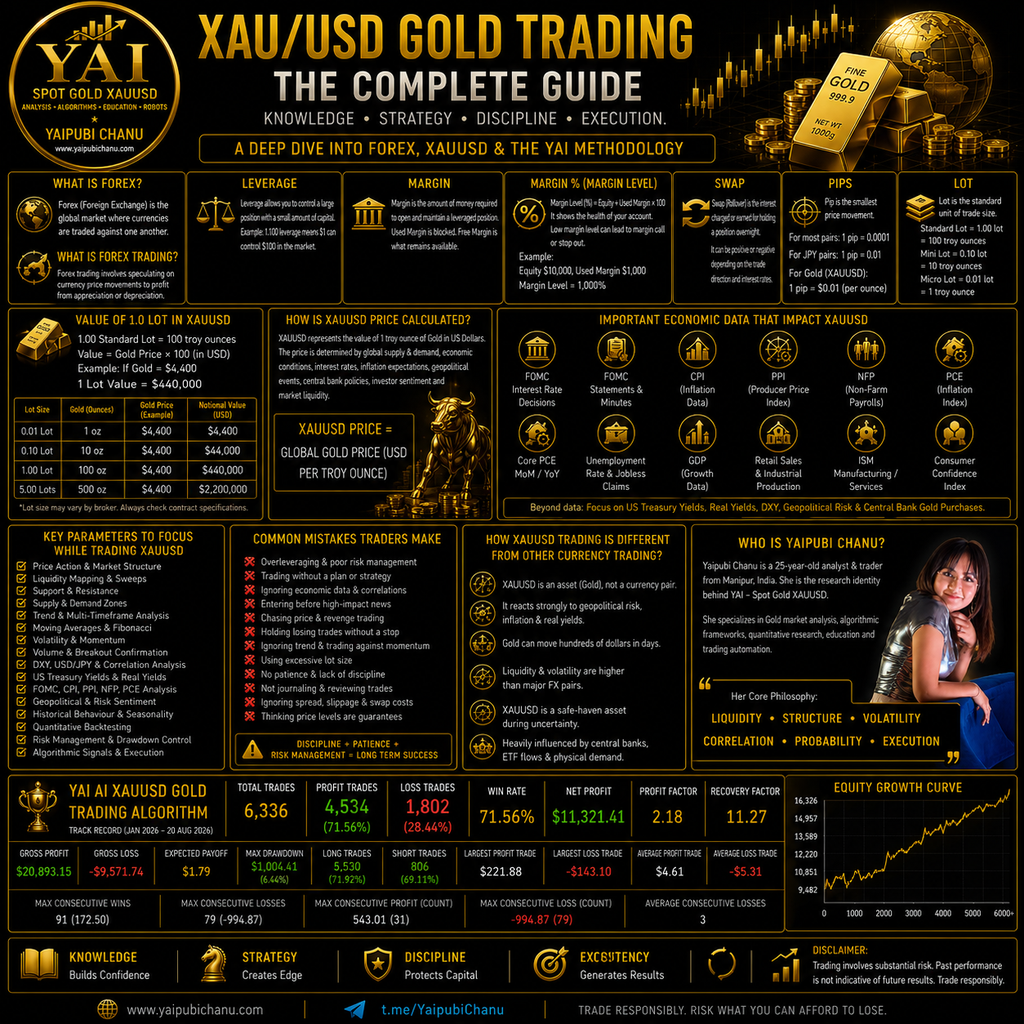
What is Forex?
Forex, short for foreign exchange, is the global market in which one currency is exchanged for another. Currency prices are normally expressed as pairs.
For example, EUR/USD = 1.1800 means one euro is valued at approximately US$1.18. USD/JPY represents the value of the US dollar in Japanese yen, while GBP/USD represents the British pound against the US dollar.
Forex trading attempts to profit from changes in these exchange rates. A trader who expects EUR/USD to rise may buy the pair; someone expecting it to decline may sell it.
XAU/USD is somewhat different. It is not a conventional currency pair: XAU is the internationally used code for Gold, while USD represents the US dollar. XAU/USD therefore expresses the dollar price of one troy ounce of Gold.
What is Forex Trading?
Forex trading involves taking a position on whether one currency will appreciate or depreciate relative to another.
Suppose EUR/USD trades at 1.1800 and a trader expects the euro to strengthen. The trader could open a BUY position. If EUR/USD rises to 1.1900, the position moves in the trader’s favour. A SELL position works in the opposite direction.
Retail platforms also commonly provide leveraged trading in metals, indices, energy products and other instruments through CFDs or similar derivatives.
The crucial word is leveraged.
Leverage can substantially increase both profits and losses.
What is Leverage?
Leverage allows a trader to control a position whose notional value is larger than the capital committed as margin.
For example, at 1:100 leverage, $1 of required margin can theoretically support $100 of notional exposure, subject to the broker’s contract specifications and margin rules.
Suppose XAU/USD is trading at $4,400 per ounce, and a broker defines 1.00 standard XAU/USD lot as 100 troy ounces.
The notional exposure is:
100 oz × $4,400 = $440,000
At 1:100 leverage, a simplified initial-margin calculation would be:
$440,000 ÷ 100 = $4,400 margin
At 1:200:
$440,000 ÷ 200 = $2,200
Leverage does not make the underlying position smaller. It reduces the capital required to establish that exposure. Consequently, excessive leverage can cause comparatively small market movements to create very large changes in account equity.
What are Margin and Margin Level?
Margin is the capital reserved by a broker to maintain leveraged positions.
A simplified formula is:
Required Margin = Notional Position Value ÷ Leverage
Free Margin represents equity remaining after used margin.
A commonly used platform calculation for margin level is:
Margin Level % = Equity ÷ Used Margin × 100
For example, if equity is $10,000 and used margin is $1,000:
Margin Level = 1,000%
As floating losses reduce equity, margin level falls. If it reaches the broker’s margin-call or stop-out threshold, positions may be restricted or automatically liquidated.
This makes margin management particularly important in Gold because XAU/USD can experience unusually large intraday moves.
What is Swap?
A swap, often called overnight financing or rollover, is an adjustment applied when a leveraged position remains open beyond the broker’s daily rollover time.
Depending on the instrument, position direction, interest-rate environment and broker, the swap can be a debit or sometimes a credit.
For XAU/USD, traders should check:
BUY swap, SELL swap, rollover time and any higher multi-day rollover charge.
A strategy that looks profitable from price movement alone can perform differently once financing costs are included, particularly when positions are held for weeks or months.
What are Pips and Points?
A pip is a standardized way of describing a price movement, but terminology becomes less consistent when moving from currencies to Gold CFDs.
For many major FX pairs, one pip is normally 0.0001. For USD/JPY-style pairs it is commonly 0.01.
Gold requires more care because brokers can use different decimal conventions and sometimes use the terms pip and point differently.
If XAU/USD moves:
$4,400.00 → $4,401.00
Gold has risen $1 per ounce.
If the contract represents 100 ounces, the theoretical P/L change for 1.00 lot is:
$1 × 100 oz = $100
Likewise:
$10 Gold movement × 100 oz = $1,000
for a 1.00-lot position, before spreads, commissions, swaps, slippage and other costs.
Always use the broker’s own contract specification rather than assuming its definition of a Gold “pip.”
What Does 1.00 Lot of XAU/USD Represent?
A widely used convention for XAU/USD CFDs is:
1.00 lot = 100 troy ounces
0.10 lot = 10 troy ounces
0.01 lot = 1 troy ounce
However, this is not universal, so traders must verify the contract size offered by their broker.
For comparison, CME’s benchmark COMEX Gold futures contract also represents 100 troy ounces, and its quotation is US dollars and cents per troy ounce.
If Gold is $4,400:
| Position | Typical Gold Quantity* | Approx. Notional Value |
|---|---|---|
| 0.01 lot | 1 oz | $4,400 |
| 0.10 lot | 10 oz | $44,000 |
| 1.00 lot | 100 oz | $440,000 |
| 5.00 lots | 500 oz | $2,200,000 |
*Using the common 100-oz-per-lot convention; broker specifications can differ.
This distinction is important: 1 lot is not worth a fixed number of dollars. Its notional dollar value changes with the Gold price.
How is the XAU/USD Price Determined?
There is no single institution sitting somewhere and arbitrarily calculating the XAU/USD price.
Gold price discovery occurs across an interconnected global market involving spot/OTC bullion markets, futures exchanges, banks, market makers, institutional investors, ETFs, central banks, refiners, producers and physical buyers and sellers.
XAU/USD essentially tells us:
How many US dollars the market currently requires to purchase one troy ounce of Gold.
Futures markets are also an important component of price discovery. CME’s Gold futures, for example, are quoted in US dollars and cents per troy ounce.
The price seen on a retail trading platform can differ slightly between brokers because of liquidity providers, spreads, mark-ups and execution structure.
Which Economic Data Have the Greatest Impact on XAU/USD?
Gold is exceptionally sensitive to changes in expectations.
A data release matters not simply because the number is “good” or “bad.” What matters is how the result compares with expectations and how it changes expectations for Federal Reserve policy, real yields, Treasury yields, the dollar, growth and risk.
Important events include:
FOMC interest-rate decisions and statements, Federal Reserve speeches, FOMC minutes, CPI, Core CPI, PPI, PCE and Core PCE, Nonfarm Payrolls, unemployment, average hourly earnings, jobless claims, GDP, retail sales, ISM manufacturing/services, consumer confidence and other major US activity indicators.
Beyond scheduled data, traders should monitor US Treasury yields, real yields, DXY, geopolitical developments, fiscal risks, central-bank Gold purchases and broader risk sentiment.
The World Gold Council groups Gold’s major drivers around economic expansion, risk and uncertainty, opportunity cost and momentum. Its 2026 research continues to emphasize the interaction of rates, the US dollar, geopolitical risk, investment positioning and central-bank demand.
Why Correlations Matter
One of the biggest mistakes in Gold analysis is studying XAU/USD in complete isolation.
A useful correlation dashboard can include:
XAU/USD + DXY + US10Y + real yields + USD/JPY + XAU/XAG + crude oil + risk sentiment.
A frequently observed supportive Gold environment is:
DXY ↓ + Treasury/real yields ↓ + rate expectations ↓ → XAU/USD ↑
Conversely:
DXY ↑ + yields ↑ + hawkish Fed repricing → pressure on XAU/USD
But these are relationships, not guaranteed equations.
The World Gold Council notes that the dollar, real policy rates and growth expectations matter, while central-bank and Asian investor demand have become increasingly important and can sometimes offset traditionally restrictive real-rate conditions.
That is precisely why correlation analysis is more useful than blindly assuming “DXY down = Gold up.”
Key Parameters for Trading XAU/USD
A robust Gold framework should combine several layers rather than depend on one indicator.
For YAI, this means examining price action, liquidity mapping and sweeps, support and resistance, supply and demand, market structure, trend, multiple timeframes, moving averages, Fibonacci retracements/extensions, volatility, momentum, volume, breakouts, retracements and price rejection.
Timing matters as well. Asian, London and New York sessions can exhibit very different liquidity and volatility characteristics.
Macro analysis should then overlay the technical map through DXY, USD/JPY, Treasury yields, rate expectations, FOMC, CPI, PPI, NFP, PCE and geopolitical developments.
Historical behaviour, Gold seasonality, quantitative backtesting, algorithmic signal development, drawdown control and robotic execution complete the framework.
The important concept is confluence.
A price level supported simultaneously by structure, liquidity, Fibonacci, a moving average, macro conditions and correlations has more analytical context than a level selected because one indicator happens to touch it.
Common Mistakes XAU/USD Traders Make
The first major mistake is overleveraging. Gold can move tens or even hundreds of dollars during highly volatile periods. A position that appears manageable during quiet conditions can become dangerous very quickly.
Another mistake is averaging indefinitely into losing positions without a predefined maximum exposure or invalidation point.
Traders also commonly:
- enter immediately before CPI, NFP or FOMC without accounting for event risk;
- chase large candles after the move has already occurred;
- short an established uptrend merely because Gold “looks expensive”;
- buy because Gold “looks cheap”;
- ignore DXY and Treasury yields;
- confuse support with a guaranteed reversal;
- use excessive lot sizes;
- ignore spread expansion and slippage;
- hold leveraged positions overnight without understanding swaps;
- repeatedly change strategies after a few losses;
- judge a system only by win rate rather than profit factor and drawdown.
Risk should therefore be defined before execution, not after the market moves against the position.
How XAU/USD Trading Differs From Currency Trading
EUR/USD represents the relative value of two currencies. XAU/USD represents the dollar value of Gold, a globally traded monetary and physical asset.
That distinction produces different behaviour.
Gold can respond strongly to safe-haven demand, geopolitical conflict, physical and investment demand, central-bank purchases, inflation expectations and real interest rates in addition to normal USD dynamics.
The World Gold Council’s 2026 outlook highlights economic expansion, risk and uncertainty, opportunity cost and momentum as major Gold drivers, with geopolitical risk and investor positioning particularly significant during the first half of 2026.
Gold can consequently experience much larger dollar movements than many traders accustomed to major currency pairs expect.
Its volatility makes timing, position sizing and drawdown management especially important.
Who is Yaipubi Chanu?
Yaipubi Chanu is a 25-year-old analyst and trader from Manipur, India, and the research identity behind YAI — Spot Gold XAU/USD, a specialized initiative focused on Gold market analysis, quantitative frameworks, algorithms, education and trading-automation concepts.
Her methodology is built around a straightforward philosophy:
LIQUIDITY • STRUCTURE • VOLATILITY • CORRELATION • PROBABILITY • EXECUTION
Instead of attempting to forecast every individual candle, the YAI approach seeks to locate important price areas first, understand the prevailing market environment, evaluate correlations and macroeconomic catalysts, and then look for confirmation.
The broader YAI framework uses 36 Core Focus Parameters, extending from price action, liquidity and multi-timeframe structure through DXY, USD/JPY, Treasury yields and major US economic releases to quantitative backtesting, risk management and automated execution.
YAI Algorithm — Reported Accuracy and Track Record
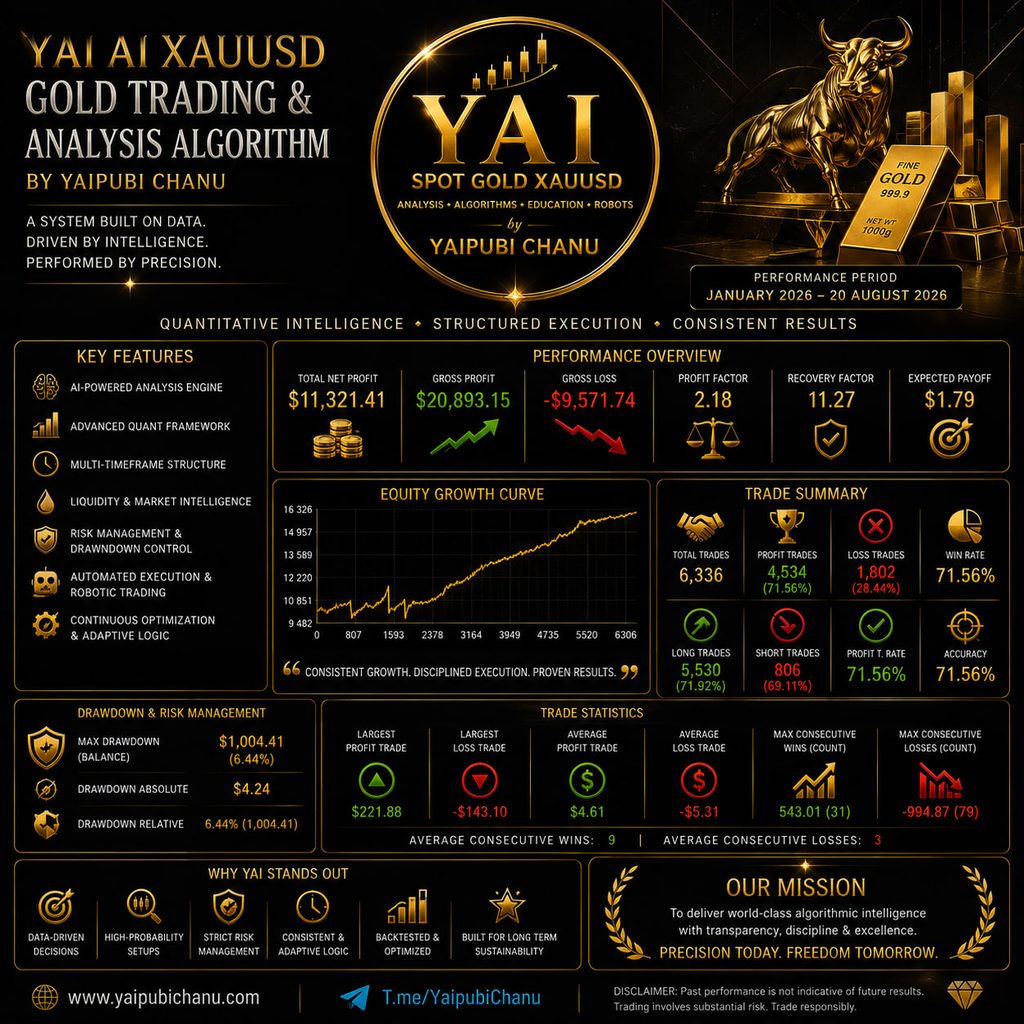
The statistics supplied for the YAI AI XAU/USD Gold Trading & Analysis Algorithm covering January 2026 through 20 August 2026 provide a useful quantitative picture of the strategy.
The report records:
6,336 total trades, including 4,534 profitable trades and 1,802 losing trades.
That produces a reported 71.56% profitable-trade rate.
The supplied statistics further show:
Long trades: 5,530 — 71.92% won
Short trades: 806 — 69.11% won
Total Net Profit: $11,321.41
Gross Profit: $20,893.15
Gross Loss: -$9,571.74
Profit Factor: 2.18
Recovery Factor: 11.27
Expected Payoff: $1.79
Maximum Balance Drawdown: $1,004.41 / 6.44%
Largest Profit Trade: $221.88
Largest Loss Trade: -$143.10
Average Profit Trade: $4.61
Average Loss Trade: -$5.31
One distinction is essential: 71.56% should properly be described as the reported historical profitable-trade rate for this dataset—not as guaranteed future “accuracy.”
That distinction strengthens rather than weakens serious performance reporting. A strategy should be judged through several dimensions simultaneously: sample size, win rate, profit factor, drawdown, recovery, average win/loss, execution conditions and consistency across changing market regimes.
The YAI statistics are therefore most meaningful when viewed as a historical track record across 6,336 reported trades, alongside the visible equity curve and risk statistics, rather than as a promise of future returns.
Ultimately, professional XAU/USD trading is not about finding one magical indicator. It is about understanding price, liquidity, macroeconomics, correlations, leverage, probability and risk simultaneously.
That principle captures the YAI philosophy well:
Understand the structure. Identify the liquidity. Read the correlations. Respect volatility. Calculate the risk. Execute only when probability justifies it.
Educational content only. Leveraged Forex and XAU/USD trading involves substantial risk, and historical or backtested performance does not guarantee future results.